Figure 3.

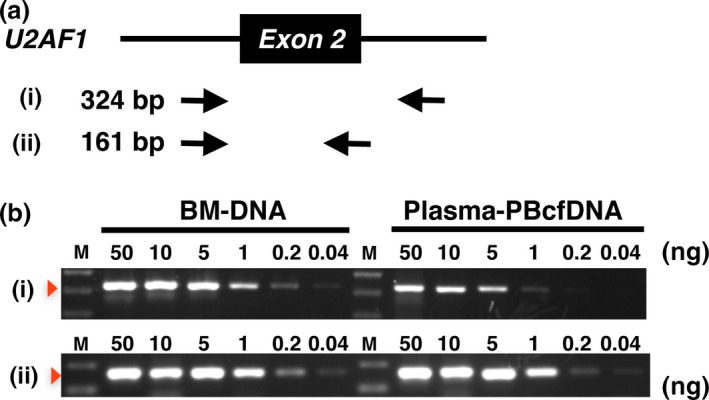
Utilization of PBcfDNA for PCR amplification. (a) Schematic representation of exon 2 and the adjacent introns of U2AF1. Two primer sets for PCR, (i) and (ii), and the size of those products are indicated. Black arrows indicate the primers. (b) Semi‐quantitative PCR was performed using (i) and (ii). BM‐DNA and plasma‐PBcfDNA were used as template DNA. The template DNA concentration in each reaction is also indicated. Note that amplification efficiencies were obviously higher with primer set (ii) than with (i) when using PBcfDNA as the PCR template.
