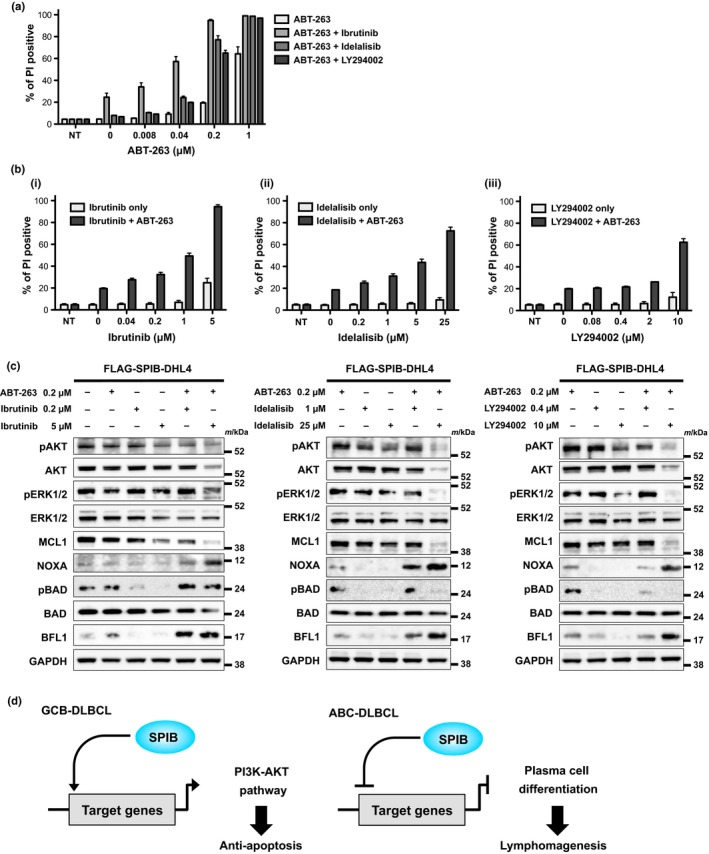
Figure 5.

Resistance of stably transduced FLAG‐SPIB SU‐DHL4 cells to ABT‐263 is overcome by AKT inhibition. (a) FLAG‐SPIB SU‐DHL4 cells were treated with ABT‐263 combined with AKT inhibitors (ibrutinib, idelalisib and LY294002) for 48 h, before analysis of cell death as in Figure 4. Cell death observed using various concentrations of ABT‐263 with or without a constant dose of ibrutinib (5 μM), idelalisib (25 μM) and LY294002 (10 μM) is indicated. Each point represents the mean value taken from three independent experiments, with error bars indicating the SEM. (b) Cell death using various concentrations of ibrutinib (i), idelalisib (ii) and LY294002 (iii) with or without a constant dose of 0.2 μM ABT‐263 is indicated. Each point represents the mean value taken from three independent experiments, with the error bar indicating the SEM. (c) Immunoblotting analyses of FLAG‐SPIB SU‐DHL4 cells. Whole cell lysates were obtained 6 h after incubation with a constant dose of 0.2 μM ABT‐263 with or without various doses of ibrutinib (0.2 and 5 μM), idelalisib (1 and 25 μM) and LY294002 (0.4 and 10 μM). Immunoblotting for pAKT, AKT, pERK1/2, ERK1/2, MCL1, NOXA, pBAD, BAD, BFL1 and GAPDH as a loading control was performed. All of the images except those of pBAD and BAD in each panel were derived from the same membrane. The pBAD and BAD images were taken from a separate membrane using the same cell lysates. (d) The schema of the putative role of SPIB expression in the pathogenesis of GCB and ABC type DLBCL.
