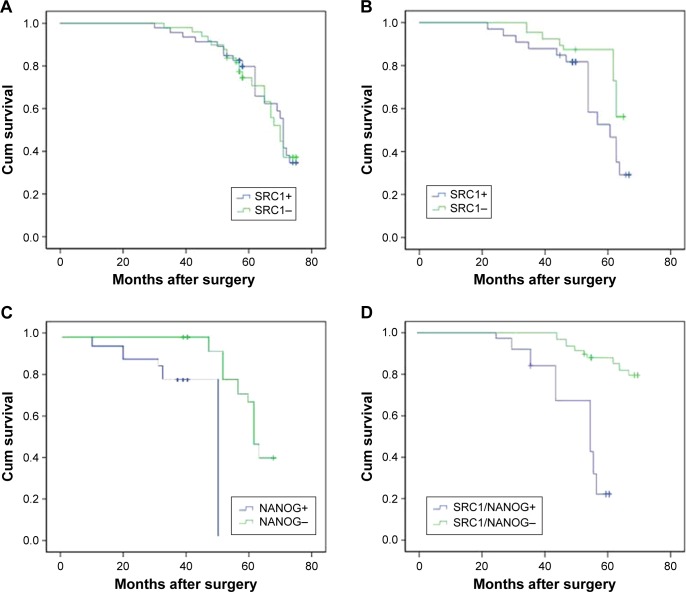
Figure 2.
Survival analysis of SRC1 and NANOG expression in breast cancer.
Notes: Kaplan–Meier curves of overall survival showed that there was no prognosis difference in the SRC1-positive or -negative groups in all enrolled cases (P=0.450; A). Survival analysis showed that the patients with a high expression of SRC1 and NANOG, as well as those with SRC1 and NANOG coexpression, had significantly poorer postoperative disease-specific survival than those with no expression in the HER-2-positive group (P=0.032, P=0.01, and P=0.01, respectively; B–D).

