Figure 1.
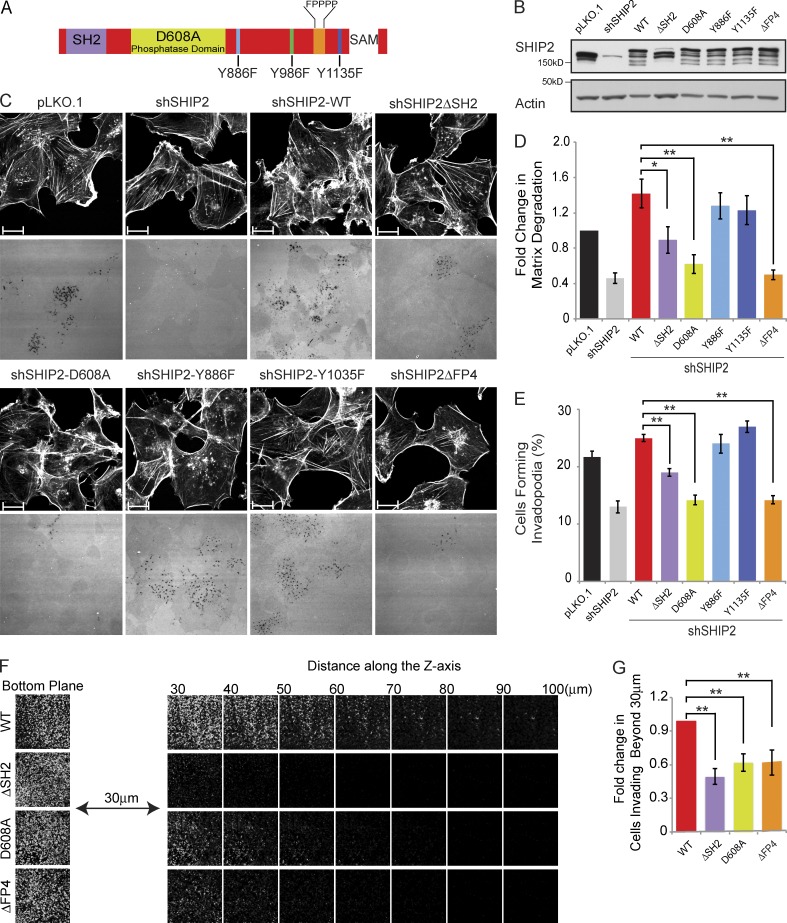
Proteolytically active invadopodia formation requires both the phosphatase activity and the scaffolding functions of SHIP2. (A) Schematic diagram of SHIP2 depicts its SH2 domain, inositol phosphatase domain, SAM domain, proline-rich region, and several phosphorylated tyrosine residues (Y886, Y996, and Y1135). (B) MDA-MB-231 cells stably expressing SHIP2 shRNA (shSHIP2-C) were transduced with retroviral vectors containing a panel of shRNA-resistant SHIP2 mutants. Upon selection for stable expression of SHIP2 mutants, cell lysates were separated by SDS-PAGE and probed as indicated to assess the protein level of SHIP2 mutants. (C) MDA-MB-231 cells stably expressing SHIP2 shRNA were transduced with retroviral vectors containing a panel of shRNA-resistant SHIP2 mutants. Upon selection for stable expression of SHIP2 mutants, cells were cultured on fluorescently labeled gelatin, and abilities of different SHIP2 mutants to rescue SHIP2 knockdown-induced invadopodia formation (percentage of cells positive for F-actin punctate overlaying matrix degradation area) and ECM degradation (mean matrix degradation area per fields of view) phenotypes were compared. (D) ECM degradation by cells expressing different SHIP2 mutants was quantified and expressed as the fold change of control (pLKO.1). (E) Percentage of cells that form proteolytically active invadopodia in cells expressing different SHIP2 mutants was quantified in comparison to control (pLKO.1). (F) SHIP2-depleted MDA-MB-231 cells rescued with shRNA-resistant wild-type SHIP2 or SHIP2 mutants (ΔSH2, D608A, and ΔFP4) were subjected to an inverted invasion assay. Representative confocal z-stack from each condition depicts relative cell invasion. (G) For quantification of cell invasion, five confocal z-stacks per condition per experiment were acquired. Fluorescence intensity of the planes within each z-stack was measured using Cell Profiler software. Cells invading to and past 30 µm inside the matrix were quantified as a percentage of total cell population. Experiments were repeated four times. All quantified data indicate the mean values ± SE from at least four independent experiments. *, P < 0.05; **, P < 0.01. Bars, 10 µm.

