Figure 5.
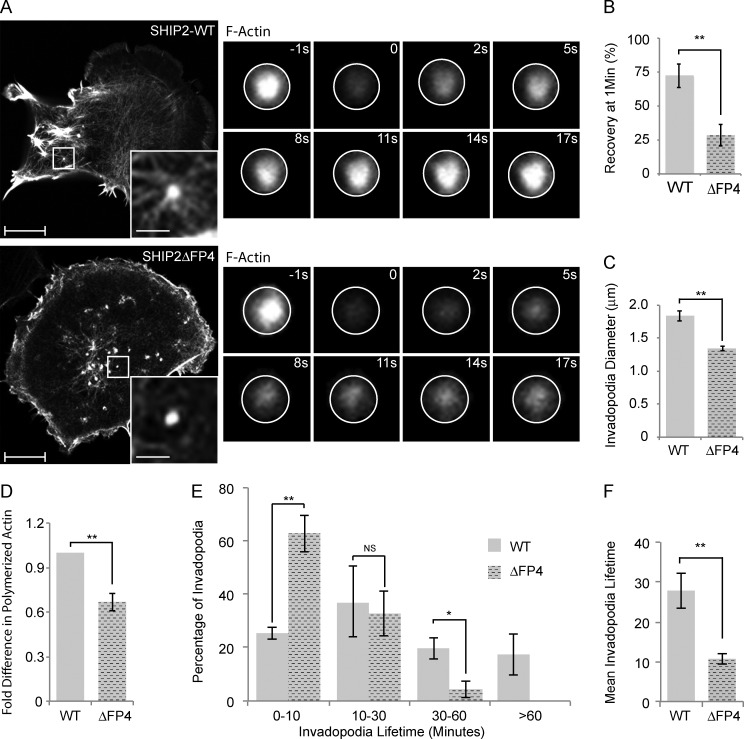
SHIP2 recruits Mena to regulate the actin network within the invadopodia membrane protrusions, hence invadopodia stability. (A) SHIP2-knockdown cells rescued with either WT-SHIP2 or SHIP2ΔFP4 were transiently transfected with tagRFP-LifeAct and subjected to FRAP analysis on F-actin–rich protrusions. Time series of WT-SHIP2 and SHIP2ΔFP4 rescued cells illustrate the delay in fluorescence recovery. (B) FRAP analysis was performed as described in A, and fluorescence recovery of 30 invadopodia protrusions acquired from three independent experiments from WT-SHIP2– and SHIP2ΔFP4-rescued cells was quantified 50 s after photobleaching. (C) SHIP2-knockdown cells rescued with either WT-SHIP2 or SHIP2ΔFP4 were transiently transfected with tagRFP-LifeAct and subjected to live time-lapse imaging, and the diameter of at least 200 invadopodia-like protrusions from three independent experiments were measured. (D) Filamentous actin content was measured from SHIP2-knockdown cells rescued with either WT-SHIP2 or SHIP2ΔFP4 and expressed as fold change. (E) SHIP2-knockdown cells rescued with either WT-SHIP2 or SHIP2ΔFP4 were transiently transfected with tagRFP-LifeAct and subjected to time-lapse video microscopy. Invadopodia lifetime was analyzed for 120 invadopodia from cells rescued with WT-SHIP2 and 85 invadopodia from cells rescued with SHIP2ΔFP4 and expressed as binned data. (F) As in E, mean lifetime was calculated for invadopodia formed in cells rescued with WT-SHIP2 and SHIP2ΔFP4. Invadopodia with lifetimes of less than 1 hour were considered for this analysis. All quantified data indicate the mean values ± SE from at least three independent experiments. *, P < 0.05; **, P < 0.01; NS, not statistically significant. Bars: 10 µm; (inset) 2 µm.

