Figure 1.
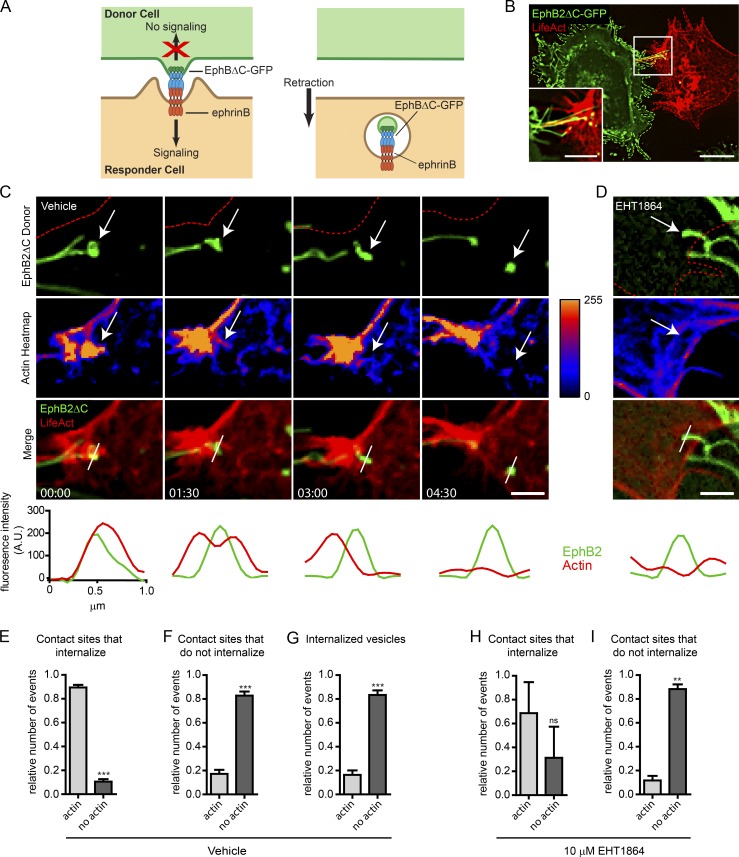
Rac-dependent actin polymerization during EphB2 trans-endocytosis. (A) Model of unidirectional EphB2 trans-endocytosis from donor cell into ephrinB+ responder cell. Interaction between ephrinB and signaling-deficient EphBΔC (cytoplasmic domain replaced by GFP) leads to ephrinB–EphB clustering (left) and vesicle formation containing receptor–ligand complexes and donor cell membrane in the ephrinB+ cell (right), enabling cell retraction (Marston et al., 2003; Zimmer et al., 2003). (B) Representative image showing EphB2ΔC-GFP (green) trans-endocytosis into an ephrinB+ SKN cell overexpressing LifeAct-mCherry (red). Cells were co-cultured and imaged live once contact occurred. EphB2ΔC-GFP+ vesicles (green and yellow puncta) can be seen in the SKN cell. Maximum projection of deconvolved images. Bars: 25 µm; (inset) 10 µm. (C and D) Time-lapse images of EphB2ΔC trans-endocytosis into ephrinB+ SKN cells overexpressing LifeAct-mCherry treated with either vehicle (C) or 10 µM EHT1864 (D; only 4-h time point shown, full time series in Fig. S1 D). Cells were co-cultured and images acquired every 90 s. Top row, EphB2 channel (red outline indicates SKN cell border); second row, heatmap for fluorescence intensity from LifeAct channel. Arrow tracks vesicle from contact point to internalization. (Bottom) Line graphs of fluorescence intensity for LifeAct (red curves) and EphB2 (green curves) measured across contact point and subsequent vesicle, as indicated by the white bar in the merge row. Maximum projection of deconvolved images. Bar, 1 µm. Elapsed time shown as minutes:seconds. (E–G) Quantifications from C. Fractions of colocalization of LifeAct with EphB2ΔC-GFP at contact sites that either lead to vesicle formation (E) or do not (F). (G) Fractions of colocalization of LifeAct with internalized EphB2+ vesicles tracked from contact. To ensure proper separation from filopodia, vesicle-actin colocalization was determined 3 min after scission was first observed. Data are presented as mean ± SE (n = 5 independent experiments; 4–10 cells per experiment, each with multiple events recorded); ***, P < 0.001, Student’s t test. (H and I) Quantifications of D and Fig. S1 B. Similar to analysis described in E and F, except EHT1864-treated responder cells were used. Data represent mean ± SE (n = 3 independent experiments; 9–10 cells per experiment, each with multiple events recorded). ns, not significant; **, P < 0.01, Student’s t test.

