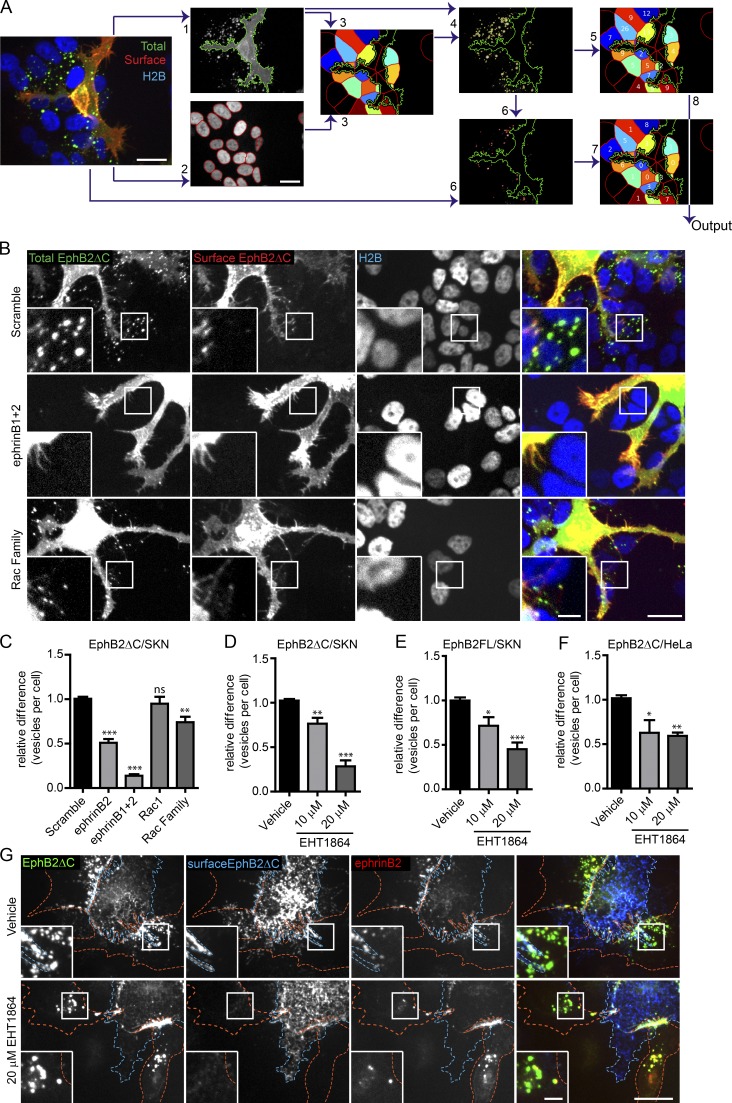
Figure 2.
Rac is required for EphB2ΔC trans-endocytosis into ephrinB+ cells. (A) Selected images highlighting important steps in semiautomated CellProfiler analysis of EphB2ΔC trans-endocytosis into ephrinB+ cells. Image acquired from ephrinB+ SKN-H2B-RFP cells (responder, shown in blue) co-cultured with EphB2ΔC-GFP/Flag–positive HeLa cells (donor, total EphB2 shown in green). Cells fixed without permeabilization and surface EphB2 labeled with anti-Flag immunostaining (surface EphB2, shown in red). (1) Identification of donor cell in GFP channel, and (2) identification of responder SKN nuclei in RFP channel. (3) SKN cells of interest (colored cells) determined by predicting cell size (50-pixel expansion from SKN nuclei) and restricting to the vicinity (<50 pixels) of the donor cell (green outline). (4) Identification of total vesicles (yellow outline) in total EphB2 channel restricted to SKN cells of interest. (5) Vesicle numbers allocated to individual SKN cell. (6) Identification of surface clusters (red outlines) from surface EphB2 channel restricted to area of total vesicles identified. (7) Surface clusters allocated to individual SKN cell. (8) Number of internalized vesicles per SKN cell (Output) determined by subtracting surface cluster number from total vesicle data. Bars, 20 µm. (B) Representative images showing the effect of Rac1 subfamily depletion on EphB2ΔC trans-endocytosis into ephrinB+ SKN cells. SKN cells were treated with siRNA for 72 h before 80 min co-culture with EphB2ΔC-GFP/Flag–positive cells. Cells were fixed without permeabilization and probed against Flag (surface EphB2ΔC, shown in red or yellow in merge). Internalized vesicles appear as green puncta (total EphB2ΔC signal) within the vicinity of the SKN nuclei (H2B channel, shown in blue). Top row, scramble siRNA (negative control); middle row, ephrinB1 and B2 siRNA (positive control); bottom row, Rac1 subfamily siRNA. Image shown as maximum projection. Bars: 20 µm; (inset) 5 µm. (C) Quantification of B. Acquired images were analyzed using CellProfiler. Results shown as mean ± SE (n = 8 independent experiments, >125 responder cells per condition per experiment, vesicle numbers per cell for the indicated siRNAs were normalized to median scramble value per experiment); ns, not significant; *, P < 0.05; **, P < 0.01; ***, P < 0.001, repeated measures one-way ANOVA with Dunnett’s post hoc test. (D) Quantification showing the effect of Rac inhibitor EHT1864 versus vehicle control on EphB2ΔC trans-endocytosis into ephrinB+ SKN cells. Results shown as mean ± SE (n = 4 independent experiments, >130 responder cells per condition per experiment); statistics are as described in C. Example images shown in Fig. S2 I. (E) Quantification of the effect of Rac inhibitor EHT1864 versus vehicle control on trans-endocytosis of full-length EphB2 into ephrinB+ SKN cells. Results shown as mean ± SE (n = 7 independent experiments, >40 responder cells per condition per experiment); statistics are as described in C. Example images are shown in Fig. S2 J. Quantification (F) and representative images (G) showing the effect of Rac inhibitor EHT1864 versus vehicle control on EphB2ΔC trans-endocytosis into ephrinB1+ HeLa responder cells. HeLa cells (red outline) overexpressing ephrinB1-mCherry (red puncta where in contact with EphB2, yellow in the merge) were treated for 4 h with either vehicle or EHT1864 at indicated concentrations. Donor cells (blue outline) expressing EphB2ΔC-GFP/Flag (shown in green) were co-cultured with responder cells for 80 min, fixed without permeabilization, and immunostained against Flag (surface EphB2ΔC, shown in blue). Cells were manually scored for internal vesicles. Results shown as mean ± SE (n = 4 independent experiments, 18–61 responder cells per condition per experiment); statistics are as described in C. Bars: 20 µm; (inset) 5 µm.

