Figure 7.
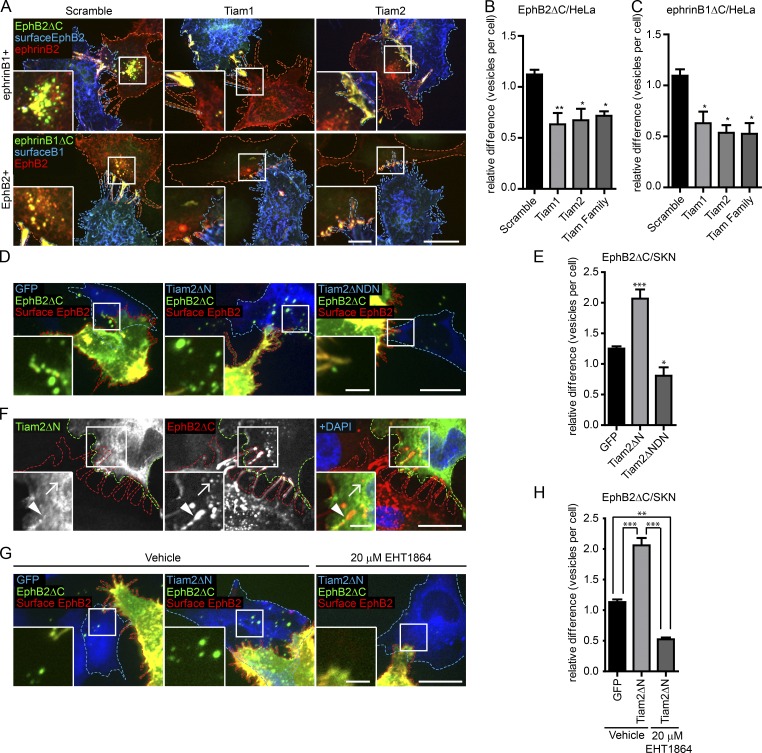
Tiam2 mediates EphB2 and ephrinB1 trans-endocytosis. Representative images (A) and quantification (B and C) showing the requirement of Tiam1 and Tiam2 for EphB2ΔC and ephrinB1ΔC trans-endocytosis into HeLa cells expressing either ephrinB1 (A and B, top row) or EphB2 (A and C, bottom row), respectively. HeLa responder cells were treated with Tiam1/2 siRNAs, alone or in combination 48 h before 80-min co-culture with donor cells. The donor cell boundary is outlined by a dashed blue border, and the responder cell boundary is outlined by a dashed red border. Internalized vesicles appear as green puncta, distinct from surface signal (appears as yellow). Number of internalized vesicles per cell was counted manually as described in Fig. 2 F. Bars: 10 µm; (inset) 2.5 µm. (B and C). Results shown as mean ± SE (n = 3–4 independent experiments, 9–57 responder cells per condition per experiment, data normalized to median scramble value per experiment). *, P < 0.05; **, P < 0.01; ***, P < 0.001, one-way ANOVA with Dunnett’s post hoc test. Representative images (D) and quantification (E) for the effect of overexpressing Tiam2 constructs on EphB2ΔC trans-endocytosis into ephrinB+ SKN cells. SKN responder cells (blue dashed outline) overexpressing GFP (left, pseudocolored blue), Tiam2ΔN-GFP/HA (Tiam2ΔN, center, pseudocolored blue), or dominant-negative Tiam2ΔN-GFP/HA (Tiam2ΔNDN, right image, pseudocolored blue) were co-cultured with EphB2ΔC-mCherry/Flag–positive cells (red dashed outline, pseudocolored green). Cells were fixed without permeabilization and probed against Flag (surface EphB2ΔC, shown in yellow). Internalized vesicles appear as green puncta in the SKN cells. Images are shown as maximum projection. Bars: 20 µm; (inset) 5 µm. (E) Results shown as mean ± SE (n = 4 independent experiments, 26–88 responder cells per condition per experiment, data normalized to median of GFP control condition); statistics as in Fig. 2C. (F) Tiam2 colocalization with EphB2 at contact sites. HeLa responder cells (green outline) overexpressing Tiam2ΔN-GFP/HA (shown in green in the merge) and untagged ephrinB2 were co-cultured with Hela donor cells (red outline) overexpressing EphB2ΔC-mCherry (red in the merge). Cells were fixed on ice, permeabilized, and immunostained against HA and DAPI. Arrowhead indicates contact site, and arrow indicates internalized vesicle. Bars: 10 µm; (inset) 2.5 µm. Representative images (G) and quantification (H) for the effect of Rac inhibitor EHT1864 versus vehicle control on EphB2ΔC trans-endocytosis into ephrinB+ SKN cells overexpressing Tiam2. SKN responder cells (blue dashed outline) overexpressing GFP (left, pseudocolored blue) or Tiam2ΔN-GFP/HA (Tiam2ΔN, middle and right, pseudocolored blue) were treated for 4 h with either vehicle (left and middle) or 20 µM EHT1864 (right) before co-culture withEphB2ΔC-mCherry/Flag+ cells (red dashed outline, pseudocolored green). Cells were fixed without permeabilization and probed against Flag (surface EphB2ΔC, shown in yellow). Internalized vesicles appear as green puncta in the SKN cells. Images are shown as maximum projection. Bar, 20 µm, inset Bar, 5 µm. (H) Results shown as mean ± SE (n = 3 independent experiments, 26–60 responder cells per condition per experiment, data normalized to median of vehicle-treated/GFP-expressing control condition). **, P < 0.01; ***, P < 0.001, one-way ANOVA with Bonferroni post hoc test.

