Figure 8.
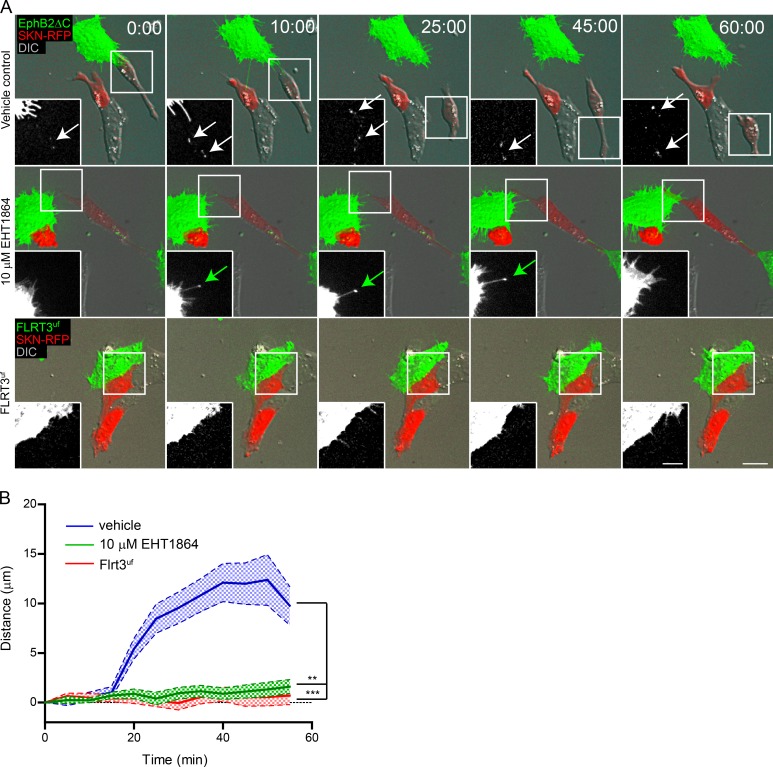
Rac mediates EphB2-triggered cell repulsion. Time-lapse images (A) and quantification (B) of the effect of Rac inhibitor EHT1864 and the requirement of EphB2 for cell repulsion in ephrinB+ SKN cells expressing mCherry (red). SKN cells were treated for 4 h with either vehicle or 10 µM EHT1864 before co-culture with cells expressing either EphB2ΔC-GFP (shown in green, top and middle rows) or FLRT3UF-Venus (shown in green, bottom row). Cells were imaged every 5 min. Inserts show the green channel, white arrows denote internalized vesicles, and green arrows indicate contact site without internalization. Maximum projection of deconvolved images. Bars: 25 µm; (inset) 12.5 µm. Elapsed time shown as minutes:seconds. (B) Measured distance between donor and responder cells over time for each condition shown as mean ± SE (n = 25–50 cells from three independent experiments); **, P < 0.01; ***, P < 0.001, two-way ANOVA.

