Figure 3.
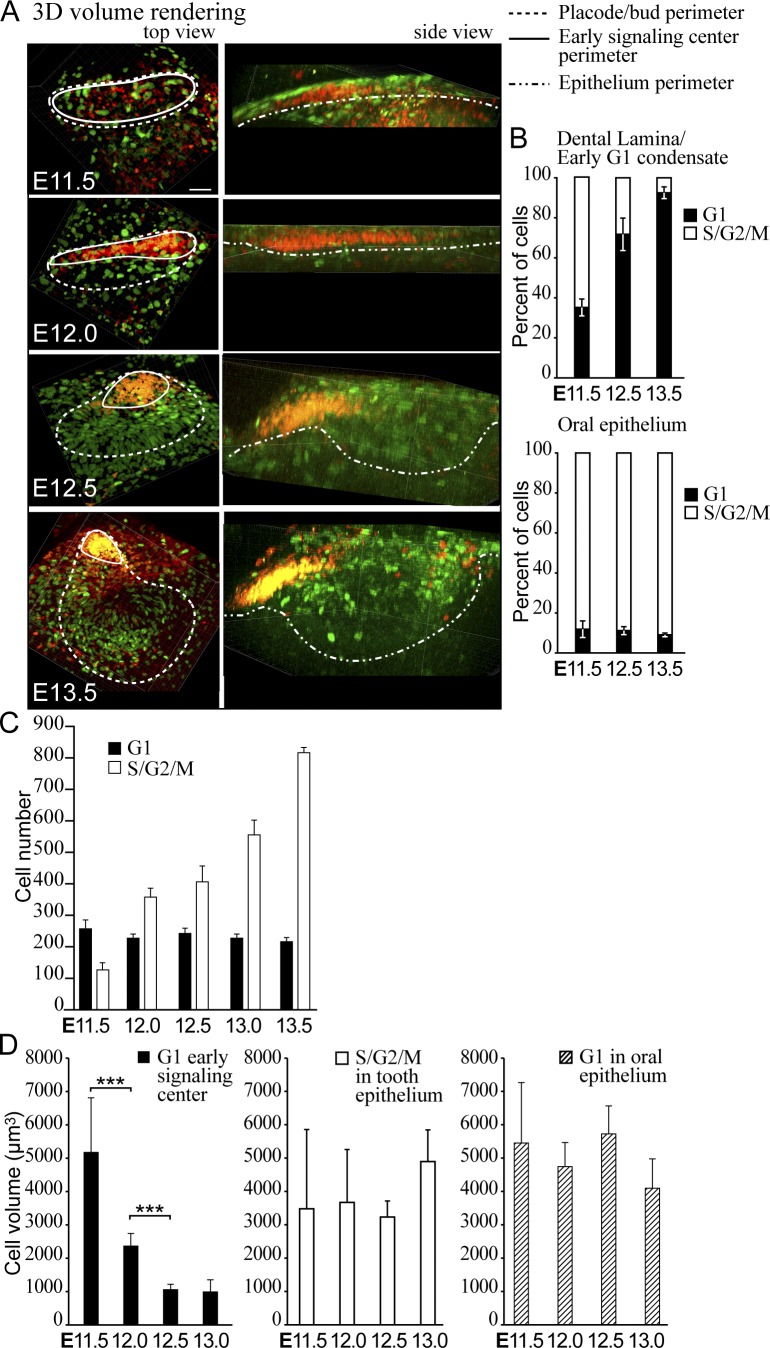
G1 cells compact, but their number stays constant during budding morphogenesis. (A) 3D volume renderings of fluorescence confocal images of whole-mount samples show the contribution of all G1 (red) and S/G2/M (green) cells at different stages of incisor bud formation. Top view: dotted line, placode/bud volume (quantification of cell number in C); solid line, representative volumes of the G1 signaling center foci (quantifications of cell percentages/numbers in B and C). Side view: epithelium volume is delineated with a dotted line. Bar, 50 µm. (B) Quantification of the percentage of cells in G1 and S/G2/M stages in the oral epithelium not contributing to the incisor showed a low number of nonproliferating cells throughout morphogenesis. In contrast to 38 ± 7.7% cells in the dental lamina, at E12.5 and later, the majority of cells in the early condensate area were in G1 (ncells oral epithelium = 350 and ncells lamina/condensate = 700). (C) Quantification of the number of cells in G1 and S/G2/M phase in the placode/bud showed a constant number of G1 cells, whereas the number of proliferating cells increased (nplacodes = 8; data shown are means). (D) Quantification of cell volume in the early signaling center and oral epithelium showed a significant reduction of cell volume over time in the G1 early signaling center population but not in the S/G2/M population or in G1 cells elsewhere in the oral epithelium (Student’s t test, ***, P < 0.001; nplacodes/time point = 8; data shown are means ± SD).

