Figure 5.
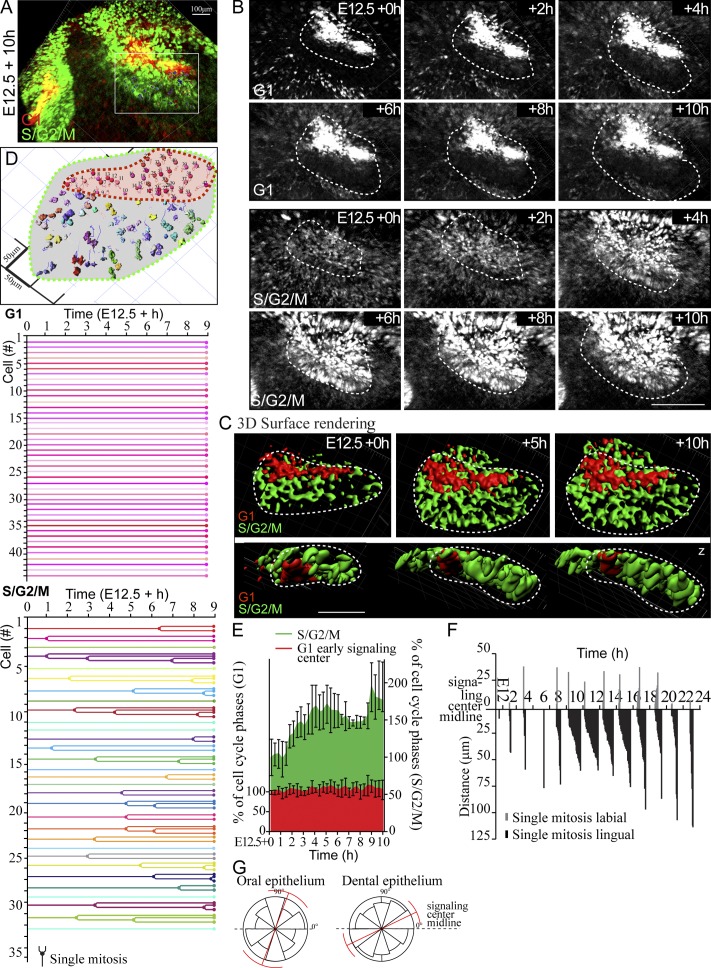
Early signaling center G1 cells do not contribute to the tooth bud. Cell division kinetics and single-cell fates in the developing incisor were analyzed with the aid of Fucci transgenes in explants imaged at E12.5 + 10 h. (A) Volume rendering of the end point of the time lapse of E12.5 + 10 h. (B) Still images of the time lapse (volume rending of separate channels for G1 and S/G2/M). G1 cells remained condensed and localized in the dental cord. In contrast, G2/S/M nuclei appeared in the adjacent cell population, and the number of proliferating cells consecutively increased as the bud invaginated. (C) Surface rendering of the bud at different stages of invagination. G1 early signaling center stayed localized whereas the cells adjacent to it proliferated and gave rise to the bud. (D) Tracing the contribution of individual G1 and S/G2/M cells originating from various positions of the forming bud. None of the early signaling center G1 cells (n = 44) progressed into S/G2/M. Of the 31 traced S/G2/M cells, 21 proceeded to cytokinesis and divided during the time lapse. The daughter cells contributed to the growing bud locally, and the cells did not exhibit apparent migratory behavior. (E) Quantification of cells from confocal fluorescence live imaging samples. Cell number at t = 0 h was adjusted to 100%. There was an increase in the bud-forming population, whereas the number of the early signaling center cells stayed constant (nplacodes = 8; data shown are means ± SD). (F) Plot of kinetics of cell proliferation. Most mitotic activity was found in the lingual cell population adjacent to the early signaling center, where a wave of mitoses started at E12.0 + 6 h, and highest mitotic activity was seen in the next 10–18 h. (G) There was no clear preference in the mitotic orientation in the forming bud (nmitoses = 100, nexplants = 5). Bars: (A and B) 100 µm; (C) 50 µm. Error bars indicate ±SD.

