Figure 8.
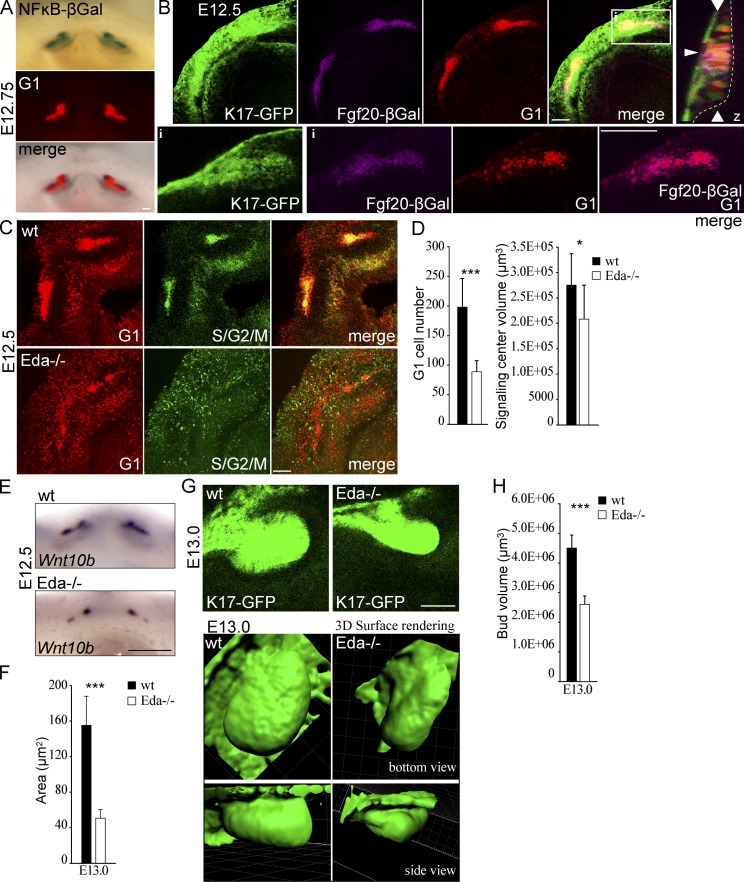
The reduced G1 cell number in the early signaling center of Eda null incisor placodes correlates with a smaller bud size. NF-κB reporter and Fgf20βGal mice were used as reporters for Eda/NF-κB signaling activity in developing incisors. (A) Whole-mount X-gal staining of an E12.75 mandible shows colocalization of NF-κB reporter activity with the Fucci G1 population. (B) Maximum-intensity projection and a single optical section (inset) of Fgf20βGal/+;Fucci G1;K17-GFP E12.5 mouse mandible. βGal staining (magenta) was confined to G1 (red) early signaling center cells (merged image of βGal and G1 only in the inset), whereas K17-GFP was expressed throughout the bud. (inset) Narrow horizontal arrowhead indicates the position of the early signaling center and wide vertical arrowheads show the xy optical section position in the orthogonal section. (C) Expression analysis of Fucci transgenes in Eda-null mandibles at E12.5 revealed that the early G1 focus often displayed a bipartite structure and was less coherent compared with the control signaling center (maximum-intensity projection). (D) Quantitation of the early signaling center G1 cell number and overall volume showed a significant decrease in the number of cells and also a decrease in the overall volume of the signaling center (Student’s t test, ***, P < 0.001; *, P < 0.05; n = 5 wt mice and n = 7 Eda−/− mice). (E) Similarly to the reduction seen in the Fucci G1 cell population, the Wnt10b signaling domain was reduced in E12.5 Eda−/− samples. (F) Quantification of the size of the Wnt10b expression domain in mutant versus control embryos (Student’s t test, ***, P < 0.001; n = 10 ctrl mice and n = 9 Eda−/− mice). (G) Comparison of bud shape (based on K17-GFP expression) showed a flatter shape in Eda-null embryos compared with control at E13.0. (H) Bud volume at E13.0 was reduced in the absence of Eda signaling (Student’s t test, ***, P < 0.01; n = 8 wt mice and n = 6 Eda−/− mice). All data shown are mean ± SD. Bars: (A and B) 100 µm; (C and E) 50 µm.

