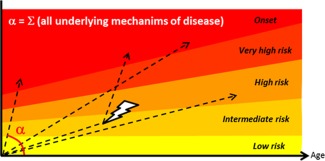
Figure 2.

Rates of T1D disease progression. In T1D, earlier onset reflects a faster rate of progression through risk levels (represented by narrower height). The risk level can be evaluated according to family history and HLA haplotype, which are fixed at birth, as well as circulating anti‐β cell autoantibodies and certain metabolic measurements, which are dynamic 9. The rate of progression (α) takes into account all causes and factors that may contribute to pathogenesis, including (but not limited to) defective deletional tolerance, defective immune regulation, defective/delayed clearance of damaged β cells, viral infection (high tropism for β cells and/or molecular mimicry), and β cell intrinsic factors such as susceptibility to infection, apoptosis or dedifferentiation (Table 2). Progression through these stages may not be linear for all individuals, as precipitating events during life (depicted by a thunderbolt) may accelerate the rate, while other environmental changes may curb it. Furthermore, accumulation of genetic (prefixed) factors may cause an individual to start at an intermediate risk, but genetic analysis other than HLA haplotype is not yet routinely performed. Successful prevention of disease will require more advanced tools to evaluate the risk level, the rate of progression, and preferably, the nature of the deficiencies that contribute to the rate of progression (Table 2).
