
Figure 6.
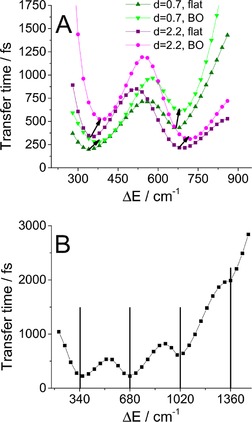
The dependence of the transfer time on energy detuning. A) Comparison of the BO and flat spectral density for two different state 1 displacements. The arrows indicate the shift of the resonance minima from the flat to the case of the BO spectral density. B) Occurrence of multiple resonances for a higher energy gap, as calculated with a flat spectral density (33). The black vertical lines mark the resonant energy gaps.