
Figure 4.
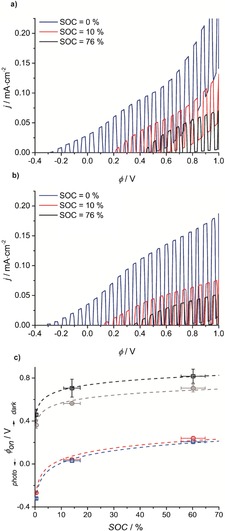
a), b) j−ϕ chopped (1 sun illumination/dark) curves recorded in the PEC cell at different SOC for two representative hematite samples from batch B (four bare and four coated) a) bare b) coated at a recording interval of 5 mV at scan rate of 10 mV s−1. c) Average ϕ on,photo (red and blue) and ϕ on,dark (black and gray) for bare hematite samples (circles) and coated (squares) with standard deviation obtained from the chopped j−ϕ curves recorded in the PEC cell and semi‐logarithmic regressions (see Table 1).