Figure 3.

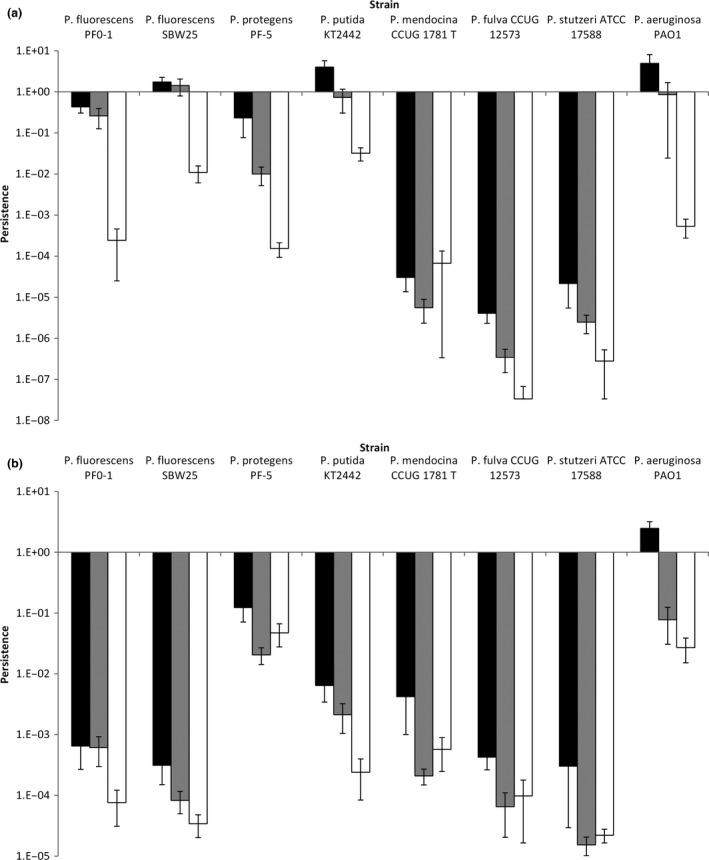
Persistence varies between strains, antibiotics and doses. Bars represent mean proportion surviving cells (± SE) after 4 h exposure to either ciprofloxacin (panel a) or rifampicin (panel b). For panel a, black, grey and white bars represent 60, 120 and 240 ng L−1, respectively. For panel b, black, grey and white bars represent 15, 30 and 60 μg L−1, respectively.
