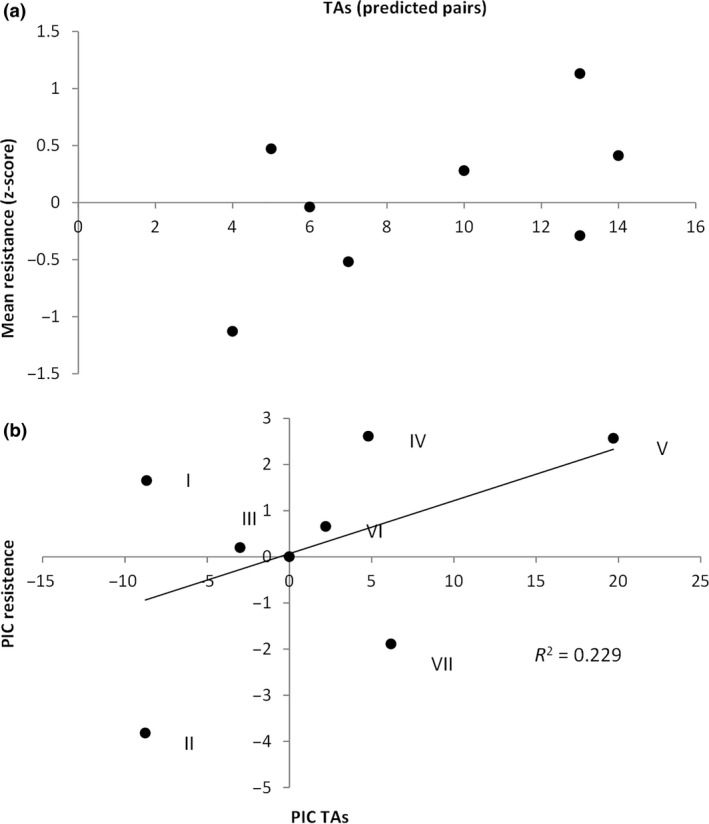
Figure 6.

(a) the number of type II toxin–antitoxin (TAs) pairs has no significant relationship with the mean level of resistance across strains. Each point represents a separate strain. (b) The number of TAs still has no significant relationship with resistance after correcting for phylogeny. Each point represents a different phylogenetic independent contrast (PIC, numbered as in Fig. 1).
