Figure 2.

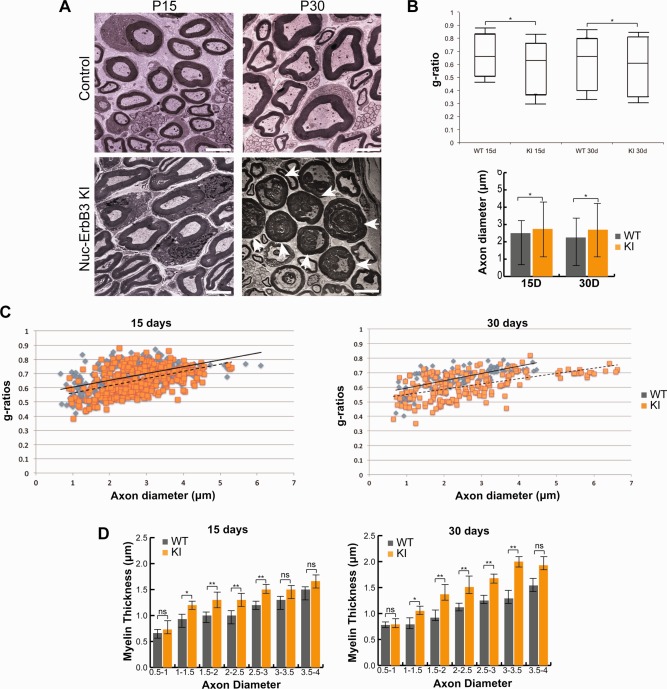
Nuc‐ErbB3 KI mice exhibit peripheral hypermyelination. (A) Electron microscopy of P15 and P30 sciatic nerves from WT and nuc‐ErbB3 KI mice shows hypermyelination in KI mice. Arrowheads at P30 show examples of severely hypermyelinated axons with condensed axoplasm in nuc‐ErbB3 KI mice. Magnification: ×4,000. (B) Quantification of g‐ratios from at least 300 myelinated axons from each time interval shows significant decrease in g‐ratios of nuc‐ErbB3 KI mice at P15 and P30. At P15 and P30 KI mice exhibit increased axonal diameter of the myelinated axons. The results are presented as average ± s.d. and significance was calculated using a paired Student's t‐test (*:P < 0.05, n = 4 mice, n.s: not significant). (C) Quantification of the g‐ratios versus axon diameters of myelinated axons between WT and nuc‐ErbB3 KI mice shows lower distribution of g‐ratios in KI mice. (D) Binning analysis of myelin thickness of group of axons with the indicated diameters. Nerves of WT and nuc‐ErbB3 KI mice at P15, and P30 were analyzed. The results are presented as average ± s.d. and significance was calculated with two‐way Anova (*:P < 0.05, **:P < 0.001, n.s.: not significant). [Color figure can be viewed in the online issue, which is available at wileyonlinelibrary.com.]
