
Figure 5.
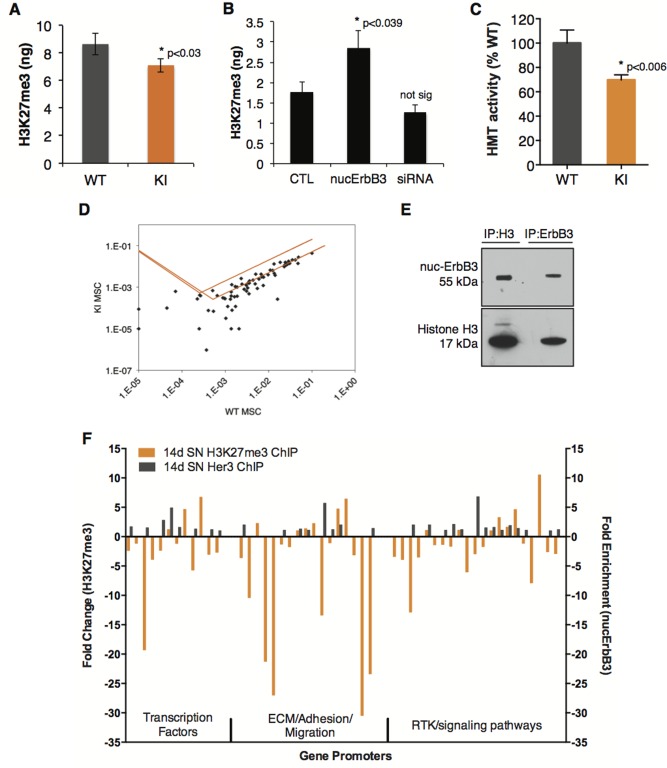
Nuc‐ErbB3 regulates total levels of H3K27me3 and HMT activity and associates with specific set of promoters in conjunction with H3K27me3. (A) Equal protein amounts of acid‐extracted histones from WT and nuc‐ErbB3 mouse Schwann cells were analyzed with a tri‐methyl H3K27 ELISA kit (Active Motif). The total amount of H3K27me3 in nuc‐ErbB3 KI mouse Schwann cells is significantly decreased compared with WT cells (n = 4, P = 0.03). (B) Rat Schwann cells were transfected with a nuc‐ErbB3 expression vector (24 h) or nuc‐ErbB3‐specific siRNA (48 h). Total amount of H3K27me3 in the cells following transfection was analyzed as in (A). Overexpression of nuc‐ErbB3 significantly increased tri‐methylation of H3K27 (n = 3, P = 0.039) while knockdown of nuc‐ErbB3 expression did not significantly change H3K27me3 levels. (C) Nuclear extracts from WT and nucErbB3 KI Schwann cells were prepared and histone methyltransferase (HMT) activity was quantified. HMT activity in nuc‐ErbB3 KI cells was normalized to WT cells (% WT activity) and was significantly decreased as compared with WT (n = 3, P = 0.006). (D) Sonicated chromatin fractions from WT and nuc‐ErbB3 KI Schwann cells were immunoprecipitated with H3K27me3‐specific antibody (Millipore) and the purified DNA was analyzed with Epitect ChIP real time PCR arrays (Qiagen) to quantify H3K27me3 marked gene promoters. Fold enrichment (normalized to input and control IgG fractions) was calculated and fold difference nuc‐ErbB3 KI versus WT is shown as a scatter plot, with the orange lines indicating the two‐fold threshold. (E) Sonicated chromatin fractions from P14 WT and KI sciatic nerves were immunoprecipitated with antibodies against total histone H3 or ErbB3 (Cell Signaling). Nuc‐ErbB3 and total histone H3 are coimmunoprecipitated from sciatic nerve chromatin. (F) H3K27me3 and nuc‐ErbB3 were immunoprecipitated from P14 WT sciatic nerve chromatin and purified DNA was analyzed with Epitect ChIP real time PCR arrays (Qiagen) as in (D). Input normalized IP values (adjusted to control IgG background) are presented as Fold Enrichment (2− ΔΔCt). Nuc‐ErbB3 enrichment at gene promoters was compared with H3K27me3 association with the same promoters. For the nuc‐ErbB3 ChIP, all genes analyzed that had >One‐fold increase are displayed on the graph (gray bars). For the H3K27me3 ChIP, all genes with >two‐fold change in nuc‐ErbB3 KI sciatic nerves and/or had nuc‐ErbB3 binding are displayed (orange bars). [Color figure can be viewed in the online issue, which is available at wileyonlinelibrary.com.]