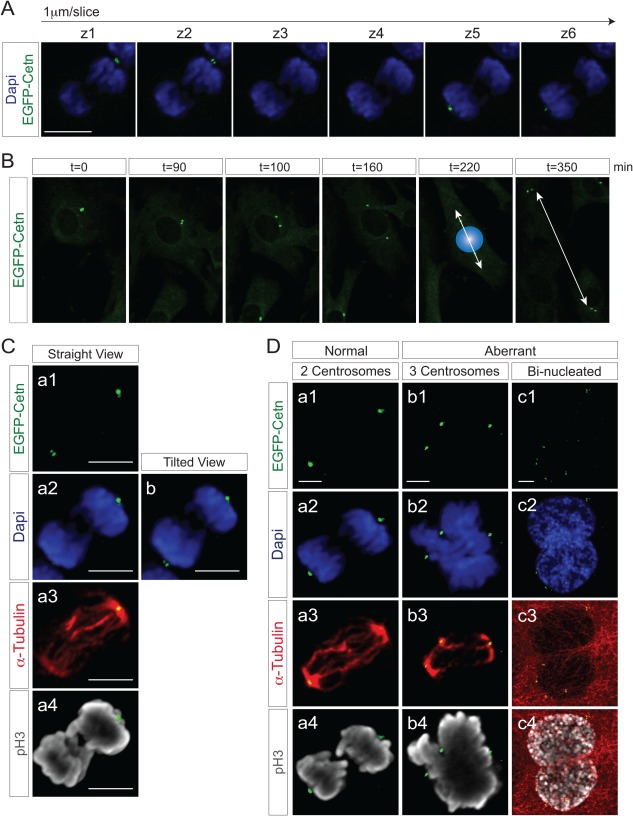
Figure 3.

Z‐stack/3D reconstitution and live imaging with ROSA‐EGFP‐Cetn1 MEFs. A: Z‐stack images of a ROSA‐EGFP‐Cetn1 MEF undergoing mitosis. Z‐stack images of were captured at the interval of 1 µm. Note EGFP‐Centrin1 at each spindle pole can be seen at distinct plane. Scale bar: 10 µm. B: Time‐lapse imaging with ROSA‐EGFP‐Cetn1 MEFs. Blue sphere represents nucleus right before cell division. C: Fluorescence microscope images of a mitotic ROSA‐EGFP‐Cetn1 MEF. Cells were immunostained with antibodies to α‐Tubulin and Serine 10 phospho‐Histone H3 (pH3). (a1‐a4): A 3D reconstructed image from straight view. Note one of EGFP‐Centrin1 signals at spindle poles was obscured (a2 and a4), but both EGFP‐Centrin1 signals can be clearly seen with tilted view (b). Scale bars: 5 µm. D: Normal cell division and aberrant cell division. (a) The number of centrosomes is strictly regulated in normal cell division. (b, c) Aberrant cell division is accompanied by extra centrosomes. Scale bars: 5 µm.
