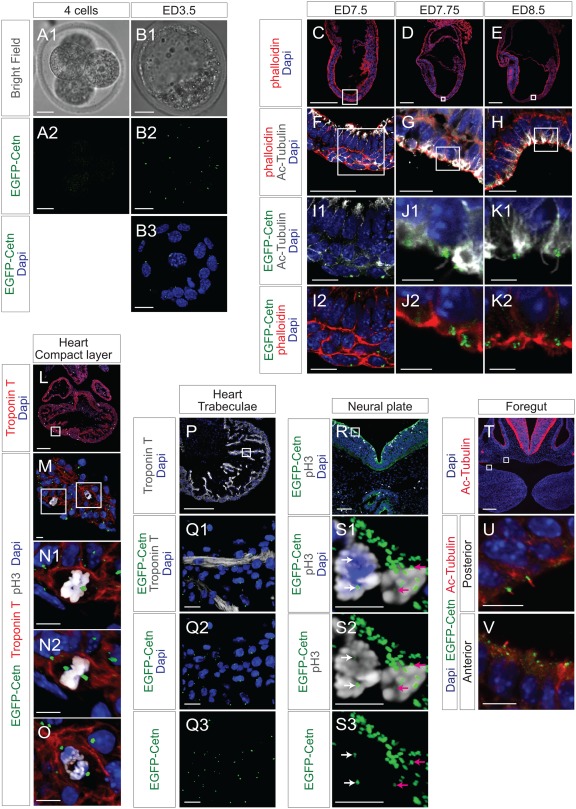
Figure 5.

EGFP‐Centrin1 in developing mouse embryo. A, B: Bright field and fluorescence microscope images of ED2.5 and ED3.5 ROSA‐EGFP‐Cetn1 mouse embryos. Note there is no significant EGFP‐Centrin1 signal on ED2.5. Scale bars: 20 µm. C, D, E, F, G, H, I, J, and K. Fluorescence microscope images of ROSA‐EGFP‐Cetn1 mouse embryo sections of ED7.5, ED7.75, and ED8.5. Embryo sections were immunostained with antibody to acetylated‐Tubulin, and stained with Phalloidin and DAPI. (I, J, K): Magnified images of square regions of (F, G, H). Note cilia formation at node (J1 and K1) and EGFP‐Centrin1 at the base of cilia (J2 and K2). Scale bars: 200µm (C, D, E), 20µm (F, G, H), 5µm (I, J, K). L, M, N, O. ED10.5 ROSA‐EGFP‐Cetn1 embryo heart sections were immunostained with antibodies to Troponin T and pH3. (M): A magnified picture of the square area of (L). (N and O): Magnified pictures of square area of (M). (N1 and O): Straight view. (N1): Note one of EGFP‐Centrin1 signals is obscured by DAPI staining. (N2): Tilted view of (N1). Note both EGFP‐Centrin1 signals can be seen. Scale bars: 200µm (L), 10µm (M, N, O). P. ED10.5 ROSA‐EGFP‐Cetn1 embryo heart sections were immunostained with antibody to Troponin T. Scale bars: 200µm (P), 20µm (Q). R and S. ED10.5 ROSA‐EGFP‐Cetn1 embryo tissue sections were immunostained with antibody to pH3. (S1‐3): Magnified pictures of square area of (R). White and pink arrows indicate a pair of centrosomes at spindle poles in each dividing cell. Scale bars: 200µm (R), 10µm (S1‐3). T, U, V. ED10.5 ROSA‐EGFP‐Cetn1 embryo tissue sections were immunostained with an antibody to acetylated‐Tubulin. Scale bars: 10µm. (U and V): Magnified pictures of square regions of (T). Scale bars: 200 µm (T), 10 µm (U, V).
