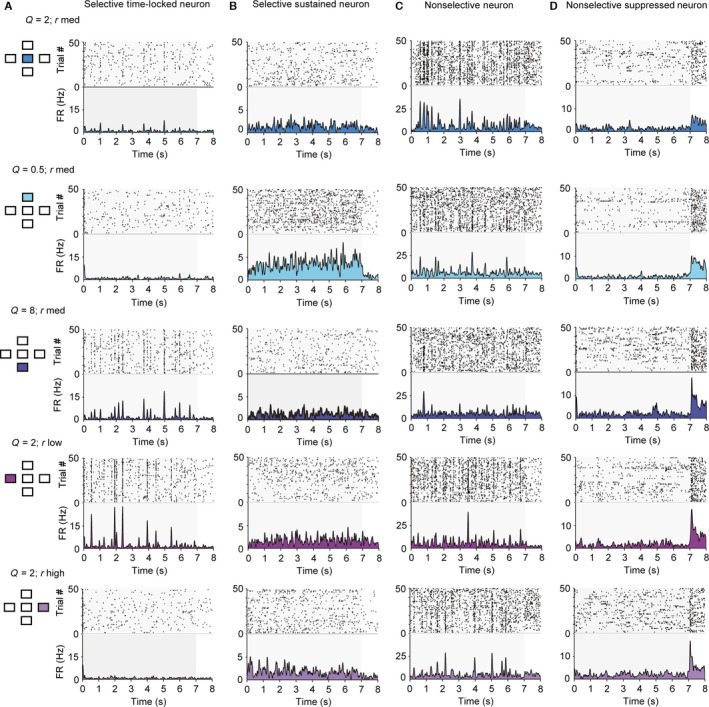
Figure 3.

Neurons in primary auditory cortex exhibit diverse responses to the five stimuli used in the study. Responses of four sample units to the five stimuli used in the study. Each row depicts raster plot and firing rate of responses to one of the five stimuli. Left inset: diagram depicting which stimulus was used (compare with Fig. 1A). (A) Responses of a selective time‐locked neuron. (B) Responses of a selective sustained neuron. (C) Responses of a non‐selective neuron. (D) Responses of a non‐selective suppressed neuron.
