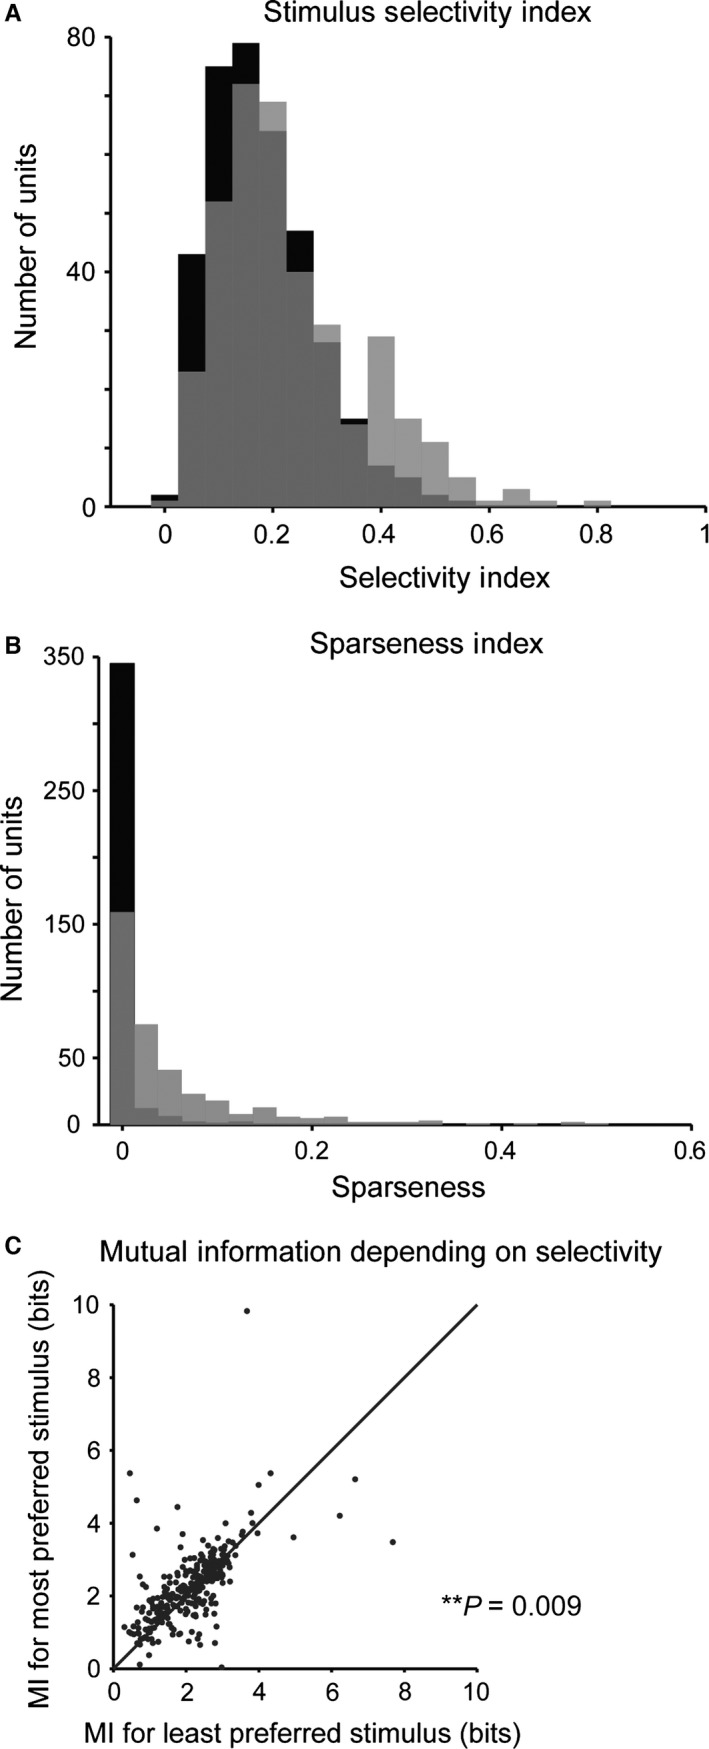
Figure 4.

Neurons in primary auditory cortex exhibit selectivity for specific spectro‐temporal statistics. (A) Histogram of stimulus selectivity index across the recorded neuronal population (grey) and for randomly shuffled responses (black). Many units exhibit selective responses to a subset of stimuli. The selectivity index is higher for recorded than for shuffled responses. (B) Histogram of the sparseness of responses across the recorded neuronal population (grey) and for randomly shuffled responses (black). Sparseness is higher for the recorded population than for shuffled responses. (C) Mutual information between the responses and the stimulus is higher for the stimulus, for which the neuron exhibits high selectivity. P = 0.009, paired t‐test.
