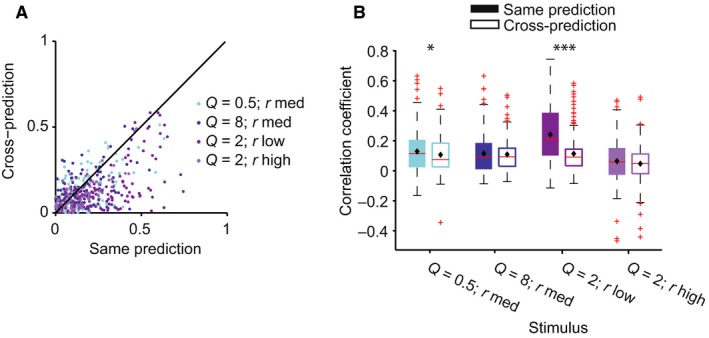
Figure 7.

LN model fails in predicting the responses of neurons to stimulus with different statistical parameters. (A) Prediction quality of the LN model, for neuronal responses to four stimuli based on a model that was fitted based on the responses to ‘cross‐condition’ (baseline, Q = 2, r med) vs. to the ‘same‐condition’. Prediction quality is significantly higher for responses to ‘same’ vs. ‘cross’ stimulus (P = 3.9e‐32 across all stimuli). (B) Quartile plot for the prediction quality of the model fitted to the ‘same’ (filled bars) vs. ‘baseline’ (open bars) stimulus. ***P < 0.001; *P < 0.05: paired t‐test.
