
Figure 1.
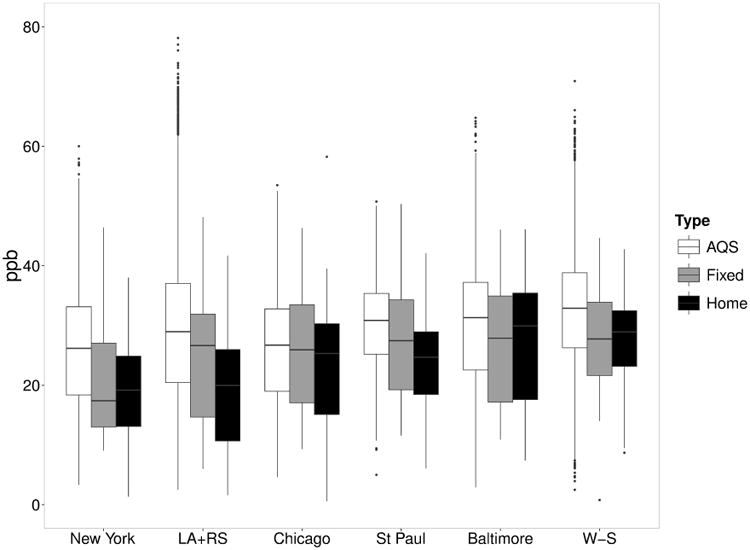
Boxplot of two-week average of ozone concentrations at AQS, Fixed and Home locations across the entire period in the six MESA regions. LA+RS: Los Angeles and Riverside in California. W-S: Winston-Salem in North Carolina. The upper, middle and lower lines in the box show the 75%, 50%(median) and 25% of the observations. The outliers are calculated as the observations higher or lower than 1.5 × IQR + median.