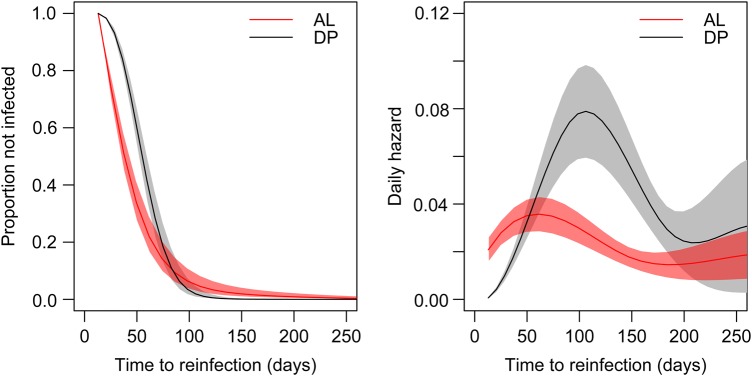
Figure 2.
Figure showing survival curves and daily hazards for children in the dihydroartemisinin-piperaquine (DP) and artemether-lumefantrine (AL) groups. The left panel shows the survival curves of the times to reinfections (in days) for both treatment arms. The right panel shows the average estimated daily hazards (average daily rates of infection) obtained by fitting models that allowed the hazard to vary as a function of time since the last treatment.

