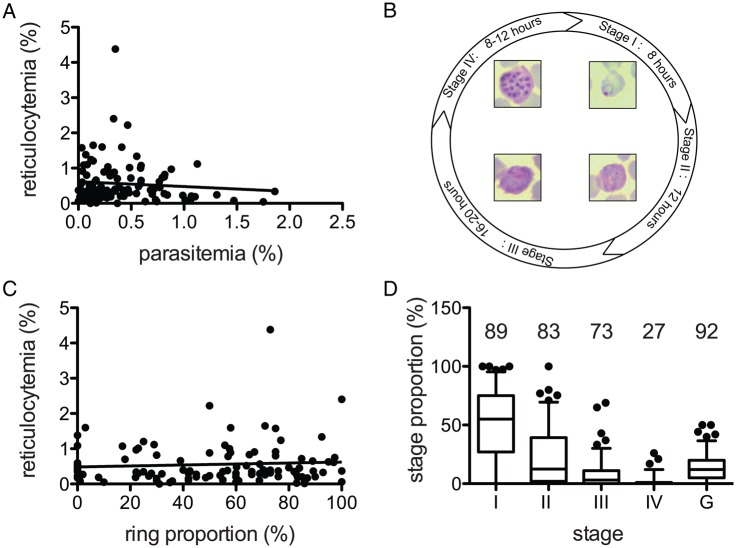
Figure 1.
Parasitemia range, reticulocytemia range, and stage distribution of Plasmodium vivax isolates. A, P. vivax–infected patients exhibit a range of parasitemia and reticulocytemia percentages at admission, but these values are not correlated (Spearman correlation; P = .8892). B, Schematic asexual blood stage development time line. The parasitized cells were categorized into 5 stages of development (stages I–IV and the gametocyte stage [G]). C, The ring proportion (stage I) of each sample was plotted against the reticulocytemia percentage. There was no correlation between the 2 values (Spearman correlation; P = .7726). D, The proportions of each stage were calculated for all samples. The number above each stage corresponds to the percentage of samples that had at least 1 of the each stage in circulation (n = 113).

