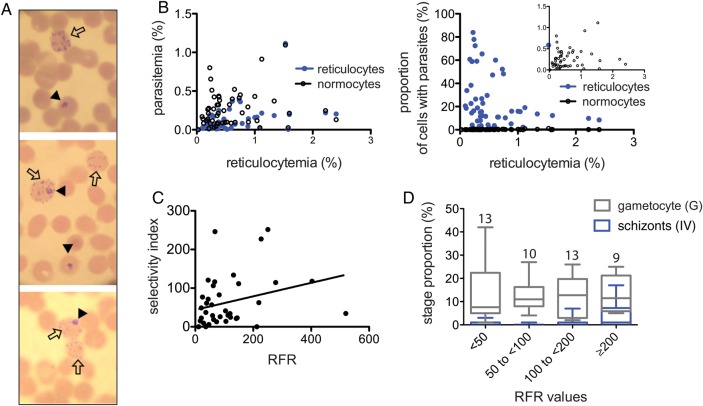
Figure 2.
Reticulocyte preference measurement and correlation with stages. A, Blood samples were stained for both parasites and reticulocytes, allowing us to detect the red blood cell type the parasite is in. Black arrowheads point to parasitized cells, and the empty arrows point to reticulocytes. B, As the percentage of reticulocytes is much lower than that of normocytes, the parasitemia percentage among infected normocytes is generally higher than the percentage of infected reticulocytes (left panel). When compared as proportion of each cell type that is infected (that is, the proportion of all reticulocytes that contain a parasite), all samples have a higher proportion of reticulocytes (right panel). C, The ratio of each data point from the 2 graphs in panel (B) results in the relative frequency of infection in reticulocytes (RFR). RFRs have a wide range and correlate with their corresponding selectivity index (Spearman correlation; P = .0193). D, The samples were divided into 4 groups of increasing RFR (<50, 50 to <100, 100 to <200, and ≥200). The number of samples in each bin is indicated above each column. The proportions of the later stages (IV) and gametocyte (G) stage for each RFR bin were compared. There were significantly more schizonts in samples with high RFRs (≥200, indicating higher restriction and selectivity; P = .042, by the Kruskal-Wallis test), with comparable proportions of gametocytes (P = .1836).

