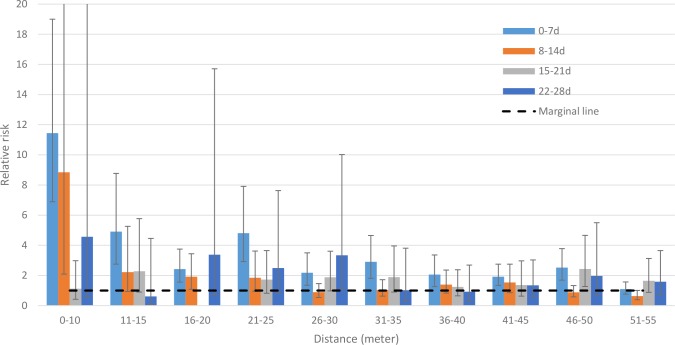
Fig 2. Relative risk for cholera between cohorts of cases and cohorts of controls in spatiotemporal scales.
Since there were no cholera cases among cohorts of index controls in the 16–20-m ring during the 15–21-d time frame, the relative risk could not be calculated. The 95% confidence intervals are shown by error bars. We cut off the upper 95% CI of the 0–10-m ring and 8–14-d time frame (which is 37.36) for better visualization of all bars and their 95% CIs.

