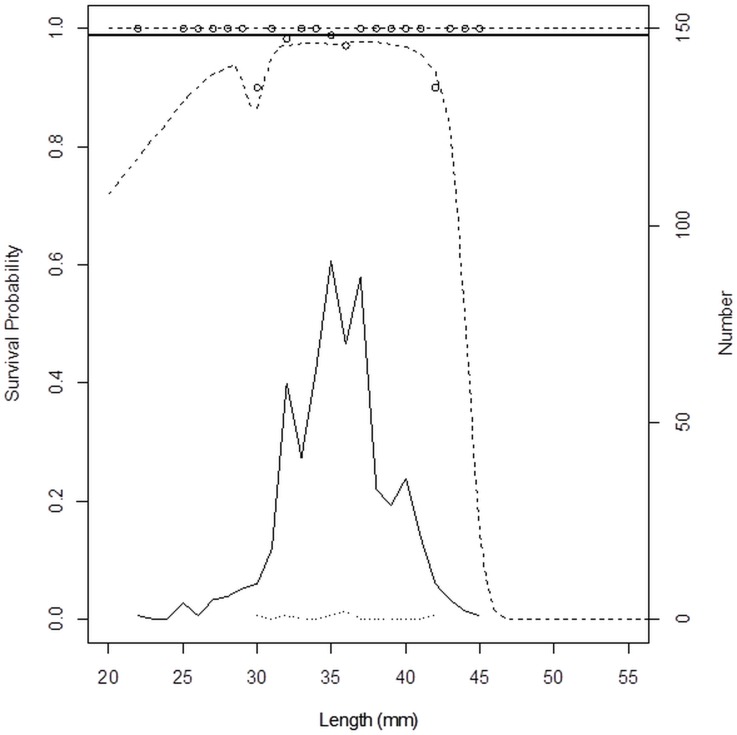
Fig 8. Length-dependent survival probability in control groups.
Circles represent experimentally observed survival probability. Solid thick line represents the modelled length-dependent survival rate at the end of observation period. Dashed lines represent 95% confidence limits for the survival probability. Thin solid line shows the number of surviving krill of each length. Dotted line shows the number of dead krill of different sizes.

