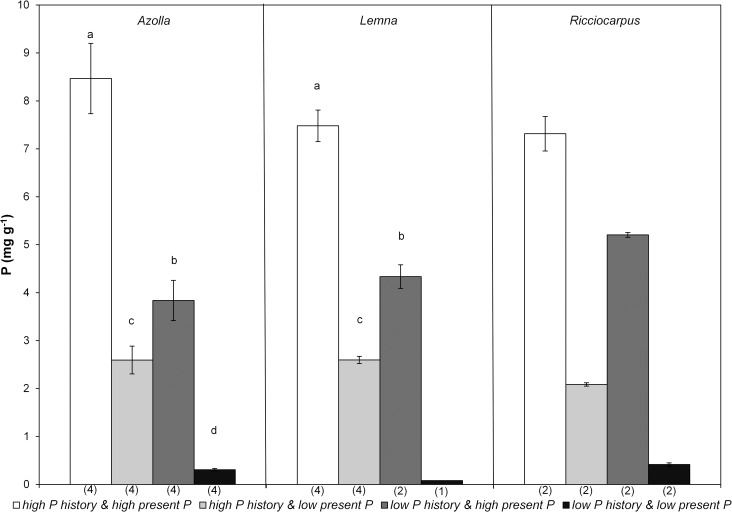
Fig 3. Mean (± standard deviation) phosphorus concentration in the plants of the monocultures of Azolla (A. filiculoides), Lemna (L. minor/gibba) and Ricciocarpus (R. natans) in the four treatments at the end of the experiment.
Different letters indicate significant differences (p<0.05) found through pairwise comparisons. Number of replicates is given between brackets below the bars.

