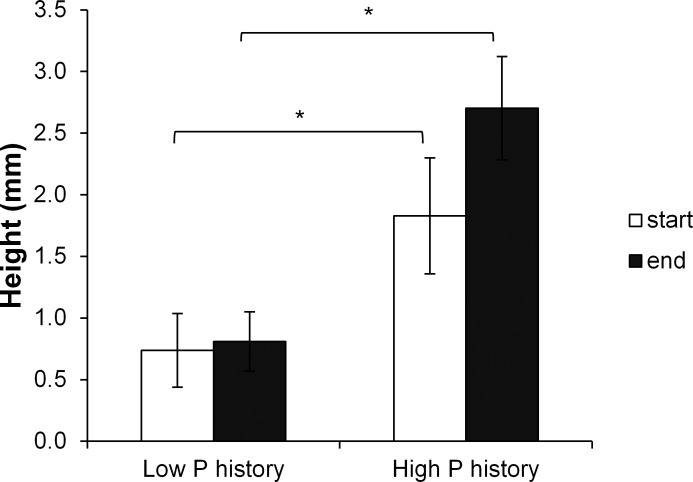
Fig 8. Height of A. filiculoides plants with a low previous phosphorous concentration (low P history) and with a high previous phosphorous concentration (high P history) at the start of the experiment and after 2 weeks of growth in medium with a high phosphorous concentration.
The brackets indicate the heights that have been compared and the stars indicate significant differences (p<0.05) determined by ANOVA.

