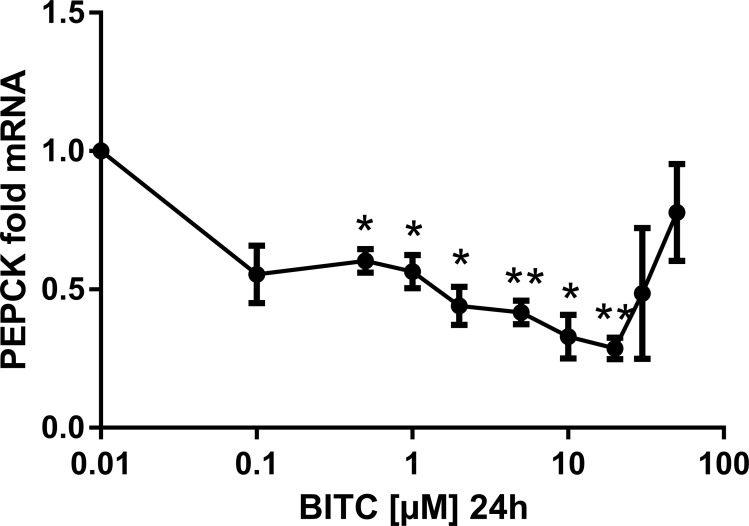
Fig 6. PEPCK gene expression in HepG2 cells modulated by BITC.
The gene expression at selected BITC concentrations (0.1 μM to 50 μM presented in logarithmic scale) is shown for PEPCK. Fold mRNA expression was normalized to the housekeeping gene RPL32 and control (0 μM BITC), the control value is unity. One way ANOVA was used for the nonlinear regression. Data shown as mean value ± SEM of gene expression versus control *(p<0.05) and **(p<0.01).

