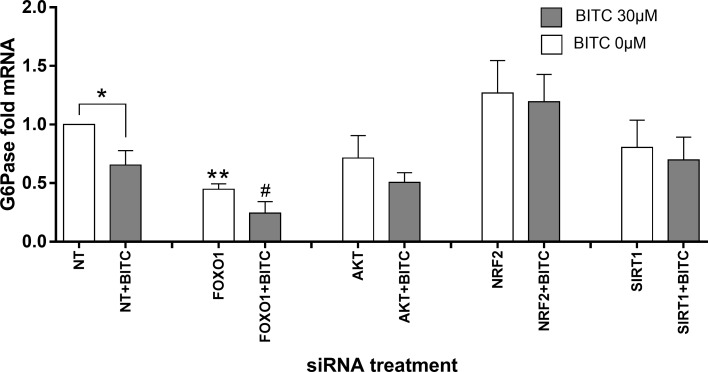
Fig 15. HepG2 cells siRNA knock-down analyses and G6Pase gene expression.
BITC 30 μM influence after starvation on G6Pase gene expression upon FOXO1, AKT, NRF2 and SIRT knock-down conditions. *p<0.05, **p<0.01 (Unpaired Student’s t test) vs control cells treated with NT “*”or NT+BITC “#”, normalized with RPL32. Data shown as mean of fold mRNA + SEM (n = 4).

