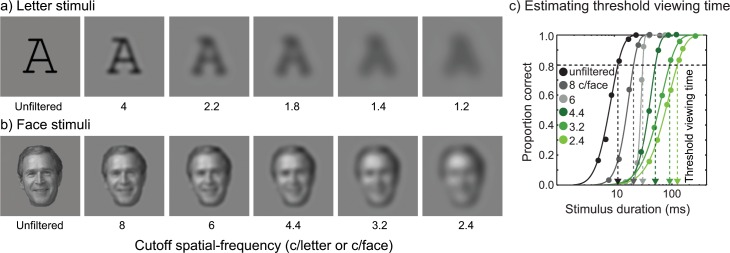
Fig 2. Sample stimulus images and illustration of psychometric functions.
(a) Sample letter images with six different cutoff spatial frequencies ranging from 1.2 c/letter to 4 c/letter including unfiltered. (b) Sample face images with six different cutoff spatial frequencies ranging from 2.4 c/face to 8 c/face including unfiltered. The size of target letter or face was 2° of visual angle. (c) Estimating threshold viewing time from a psychometric function. For a given cutoff spatial-frequency, object recognition performance was measured as a function of stimulus duration (msec). Six different exposure durations were interleaved within a block. Each duration was repeated 30 times, resulting in a total of 180 trials for each psychometric function. Target object recognition was tested for each duration and percent correct recognition was computed at each stimulus duration. The resulting data (solid circles) were fit with Weibull functions [51] to derive a threshold viewing time (dotted arrow line) defined as the stimulus duration yielding 80% recognition accuracy (black dashed line). The solid line is the best fit of the function. A psychometric function was obtained for each cutoff spatial-frequency, amounting to six psychometric functions for each participant.

