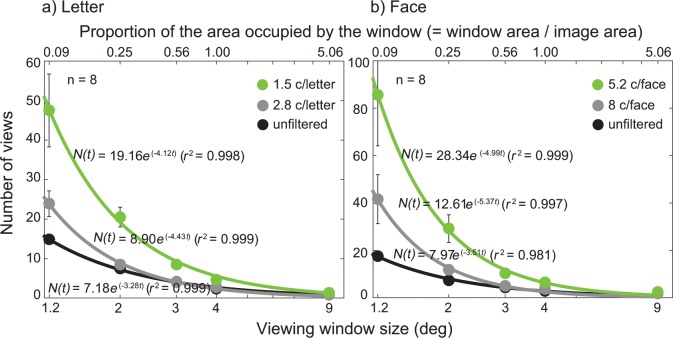
Fig 3. The results from the viewing window study for letter and face.
The number of views was plotted as a function of window size (°) for three different blur levels: unfiltered (black dots), 2.8 c/letter or 8 c/face (gray dots), and 1.5 c/letter and 5.2 c/face (green dots). Stimuli were 26 uppercase letter (a) or 26 celebrity faces (b) with the image size of 4° of visual angle. The percent of the area occupied by the moving window with respect to the area of the target image was shown on the upper x-axis. Each data point (solid dots) was an average of the number of views across participants (n = 8). Data were fitted with the exponential-decay function (Eq 2). The solid lines are the best fits of the model. Error bars represent ±1 Standard Errors of the Mean (SEM).

