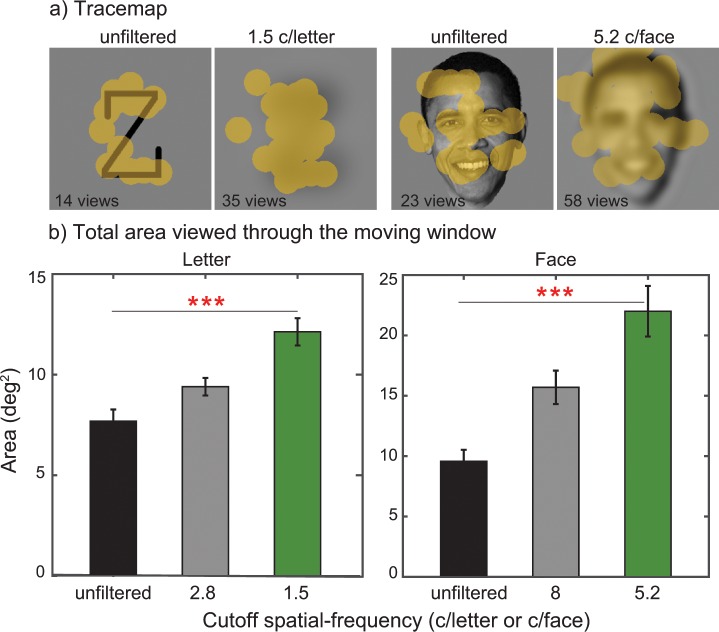
Fig 4. Examples of traces of the gaze-contingent moving window and the total area viewed by the moving window.
(a) These trace maps show example trials (correct trials) taken from letter or face recognition for unfiltered and the lowest cutoff spatial-frequency (1.5 c/letter for letter and 5.2 c/face for face). The traces of the moving window (yellow blobs) were superimposed on target images. (b) Mean total amount of viewed area (deg2) collapsed across participants (n = 8) was plotted as a function of cutoff spatial-frequency (blur level) for letter and face. Area data were computed by aggregating the regions (e.g., yellow blobs in Fig 4A) of an object image viewed through the moving window (1.2°). Error bars represent ±1 SEM. Note that three asterisks (***) indicate the p value of < 0.001.

