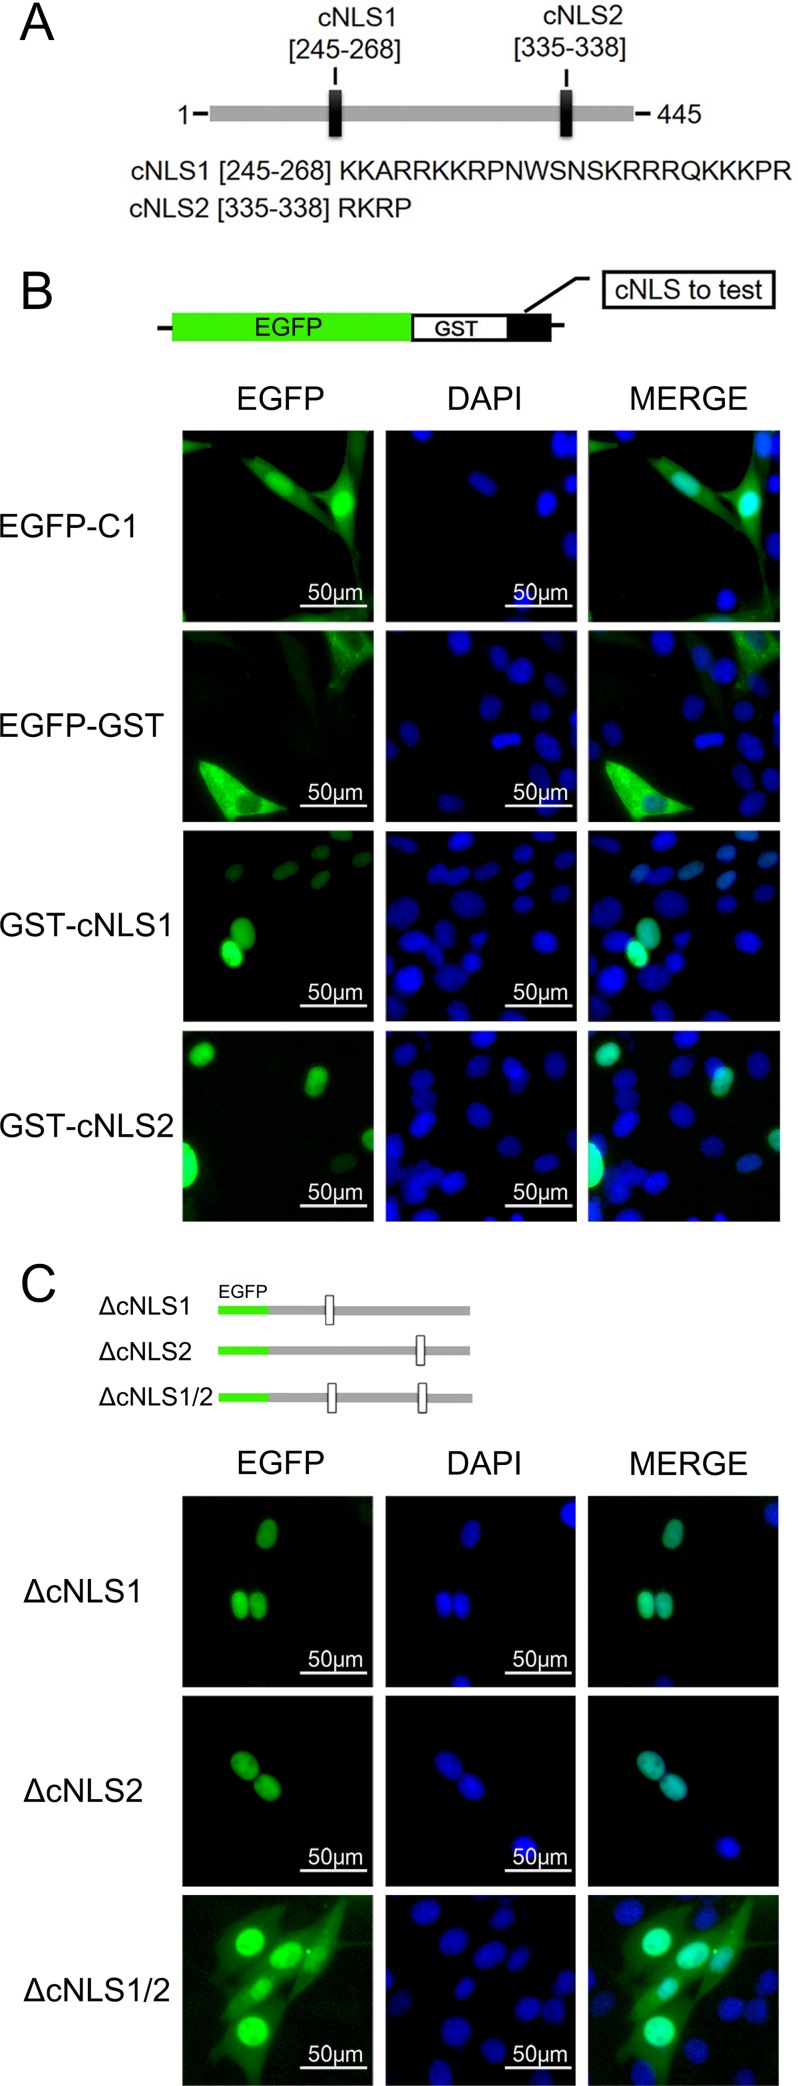
Fig 3. Functional validation of the Ipr1 cNLSs.
(A) Schematic representation of Ipr1 protein. The positions of two cNLSs (black rectangles) identified by web-based program analyses are indicated, and the sequence of each cNLS is presented below. (B) Schematic representation of the EGFP-GST construct used in the nuclear import assessment. Each Ipr1 cNLS sequence was cloned into downstream of the EGFP-GST. The fluorescence images show representative samples of NIH3T3 cells transfected with each of the expression plasmids for 24 h. The cell nuclei were counterstained with DAPI. (C) Schematic representation of Ipr1 mutants bearing deletions of cNLS1, cNLS2, or both. The fluorescence images show representative results from the nucleocytoplasmic localization of these Ipr1 mutants in NIH3T3 cells. The cell nuclei were counterstained with DAPI.

