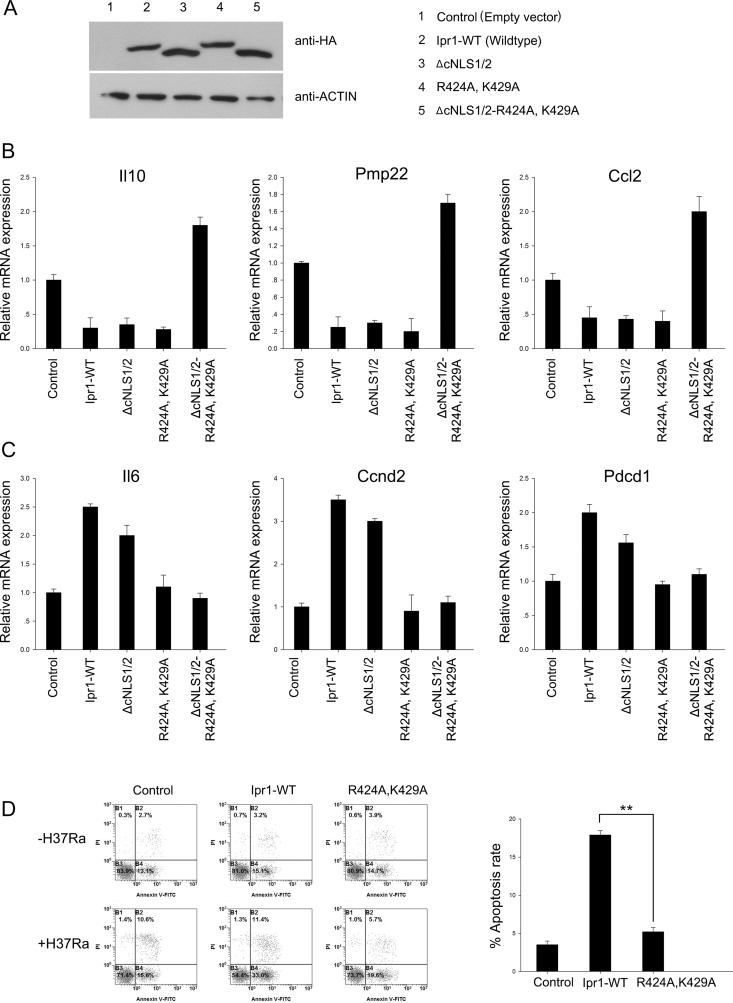
Fig 5. Functional activity of wildtype and mutant Ipr1 in regulation assays.
(A) A representative blot from a western blot analysis demonstrating the expression of the different mutant proteins. (B) Results from an assay measuring the gene repression induced by Ipr1. The expressions of Il10, Pmp2, and Ccl2 were determined by qPCR after the transient transfection of RAW264.7 cells with wildtype Ipr1 or various Ipr1 mutants. (C) Results from an assay measuring the gene activation induced by Ipr1. The expressions of Il6, Ccnd2, and Pdcd2 were determined by qPCR after the transient transfection of RAW264.7 cells with wildtype Ipr1 or various Ipr1 mutants. (D) RAW 264.7 cells were transfected with empty vector as control, wildtype Ipr1, or Ipr1-R424A-K429A. After 12 h, each group of transfected cells was incubated in the absence or presence of H37Ra. Apoptotic cells were evaluated by Annexin-V staining followed by flow cytometric analysis. The apoptotic cell rate, which is presented in the right panel, was quantified by the following algorithm: percentage of Annexin-V+ and PI− cells in the presence of H37Ra minus the percentage of Annexin-V+ and PI− cells in the absence of H37Ra. Data represent the mean ± SD of three independent experiments. Two asterisks, p < 0.01.

