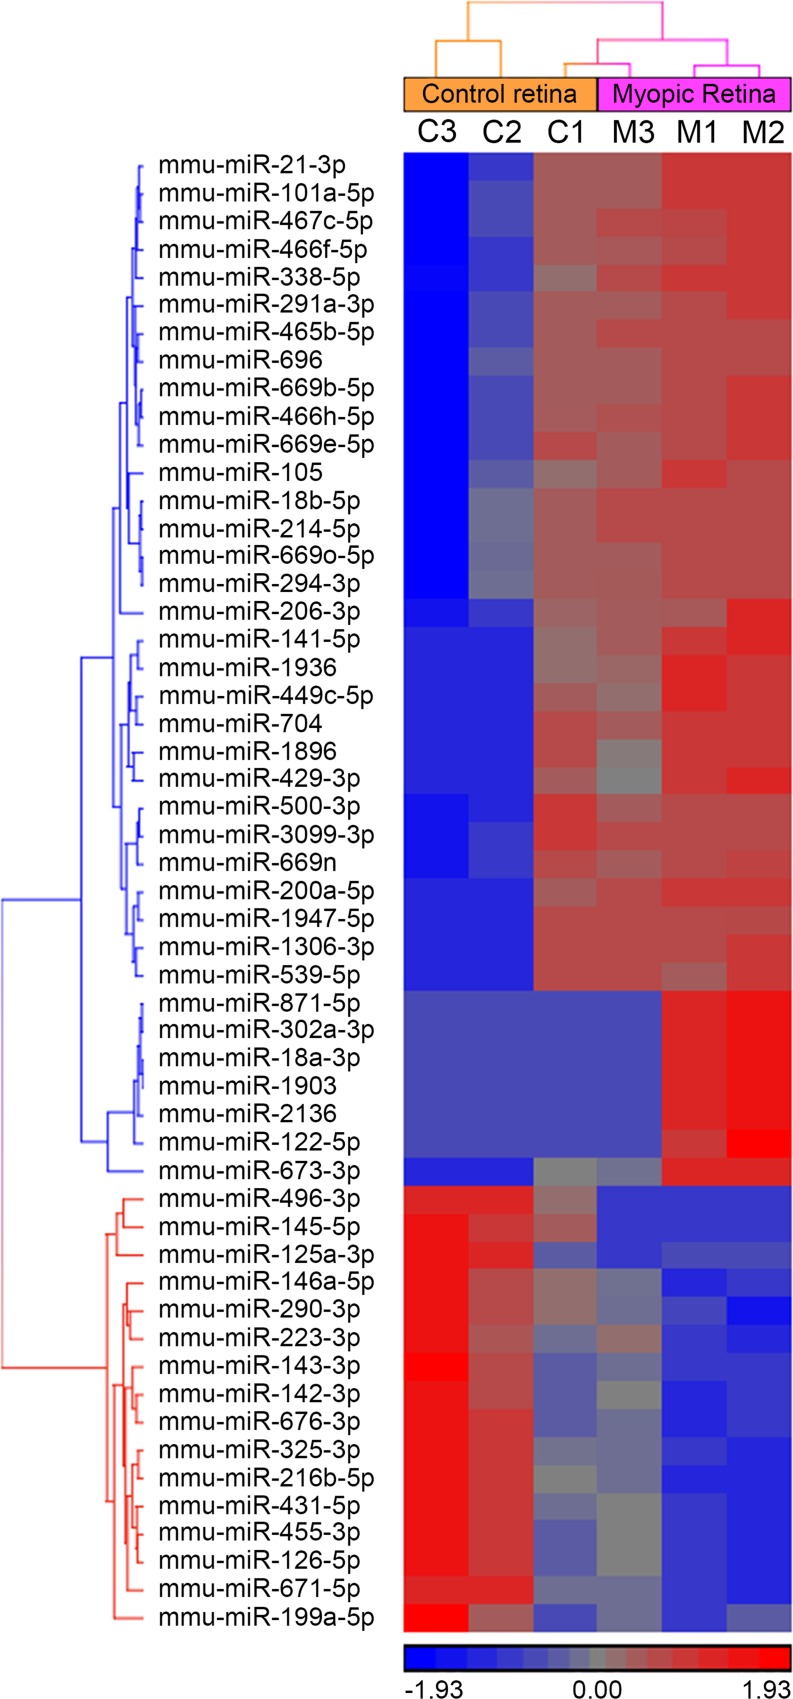
Fig 2. Hierarchical cluster analysis of 53 miRNAs differentially expressed in the myopic retina versus control retina.
Logarithmic values (base 2) of Agilent total gene signal for differentially expressed miRNAs (cutoff: FC > 2, FDR-adjusted p-value < 0.05) were quantile normalized, shifted to mean of zero, scaled to standard deviation of 1.0 and subjected to hierarchical clustering using Euclidean dissimilarity and average linkage. The color scale indicates transcript abundance relative to the mean of zero: red identifies an increase in relative miRNA abundance; blue identifies a decrease in relative miRNA abundance. Columns show individual samples, whereas rows show individual miRNAs. Control samples c1, c2, and c3 correspond to myopic samples m1, m2, and m3 respectively. The “co-clustering” of the control sample c1 and myopic sample m3 resulted from the clustering algorithm that was used to generate the cluster and reflects individual differences in gene expression as well as differences in the myopic response to visual form deprivation between animals. It appears that the myopic response in the animals comprising experimental group 1 (samples c1 and m1) was the weakest among the 3 groups. However, the relationship between control sample c1 and the corresponding myopic sample m1 follows the same pattern as in the other two experimental groups even though samples c1 and m1 fall within the same color scheme. Consistent up- or down-regulation of the specific miRNAs in the myopic eyes versus corresponding control eyes across all samples is reflected by the low p-values shown in Table 1.

