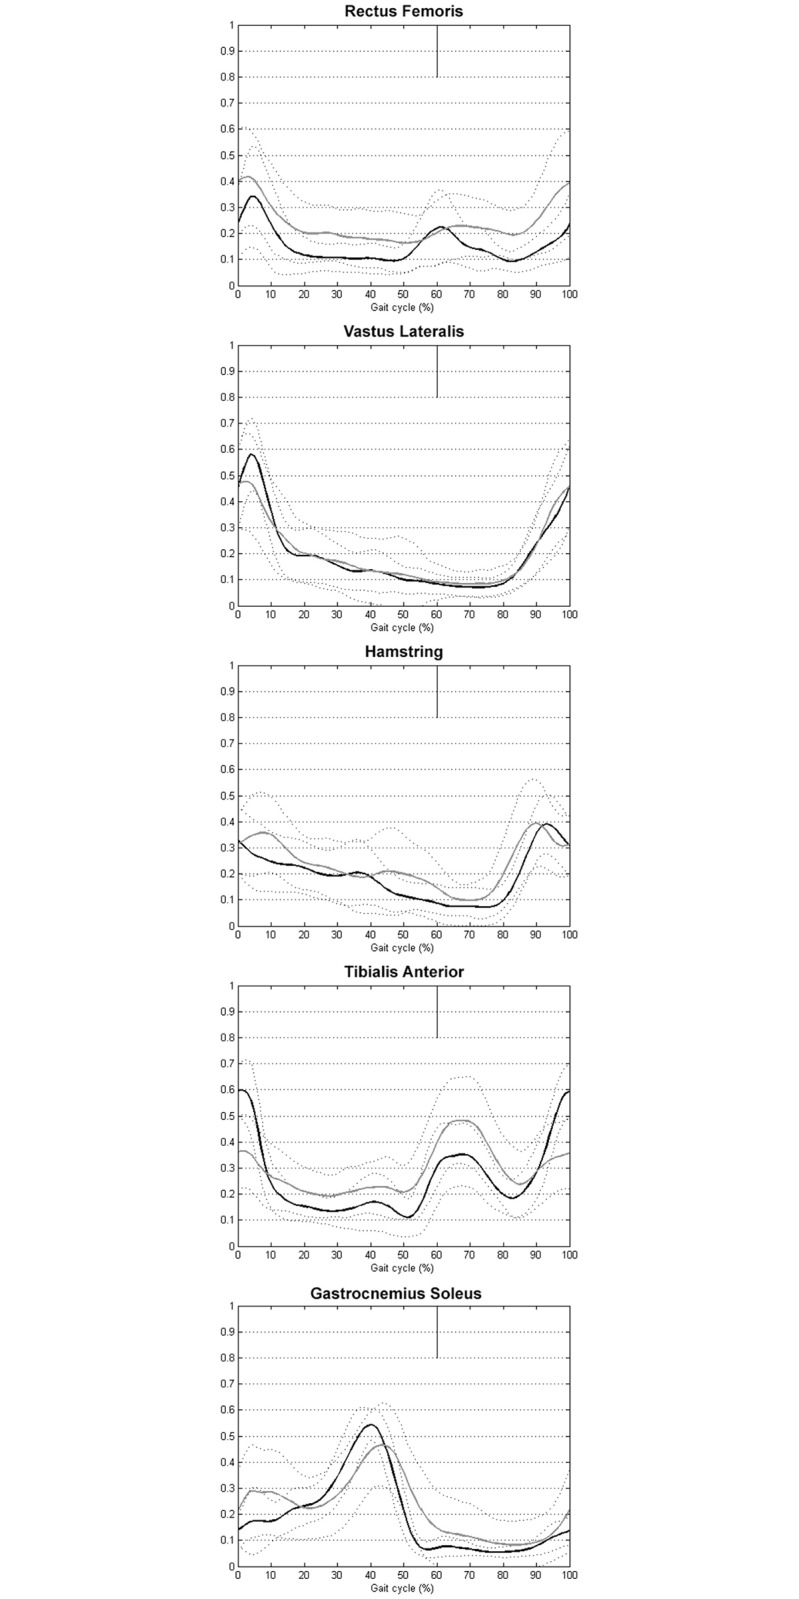
Fig 2. DMD group EMG profiles superimposed on control group EMG profiles.

The percentage of the gait cycle is presented on the X-axis (0: heel strike, 100: the following ipsilateral heel strike) and the normalized amplitude of EMG activity on the Y-axis (0–1). The black (control group) and grey (DMD group) lines represent the mean linear envelope of muscle activation (mean of both sides). Dashed lines represent the mean ± standard deviation.
