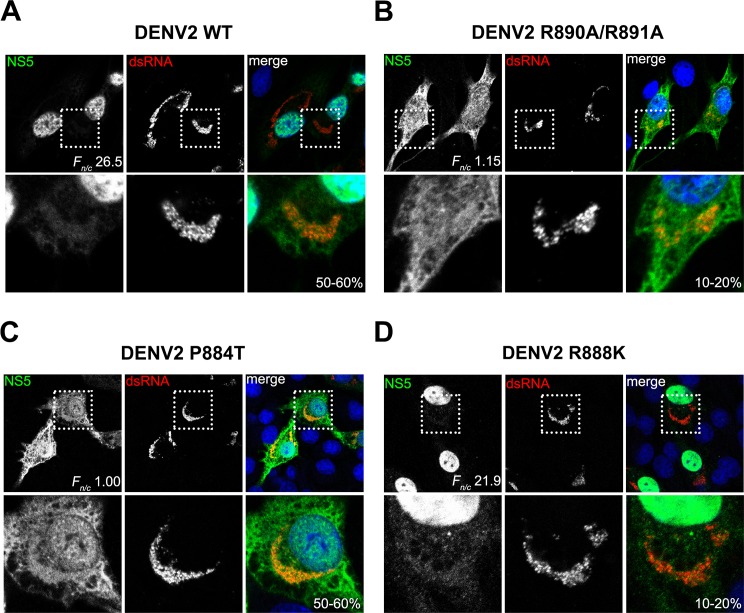
Fig 8. Polyphenotypic distribution of NS5 and dsRNA in wild type and mutant DENV in transfected cells.
BHK-21 cells transfected with (A) DENV2 WT, (B) DENV2 R890A/R891A (C) DENV2 P884T and (D) DENV2 R888K (as in Fig 7) were analysed for presence of NS5 (green) and dsRNA (red) by IFA on day 3 post-transfection. Digitized images were captured by Zeiss LSM 710 upright confocal microscope by 63× oil immersion lens and image analysis was performed on with ImageJ software [52] to determine the nuclear to cytoplasmic fluorescence ratio (F n/c) of NS5 as done previously [17, 29, 30, 42]. The mean F n/c ± SEM was calculated for ≥ 30 cells and the F n/c values together with % of infectivity are indicated. Data from one experiment are shown. Insets: zoom-in views of the dotted boxed regions.

