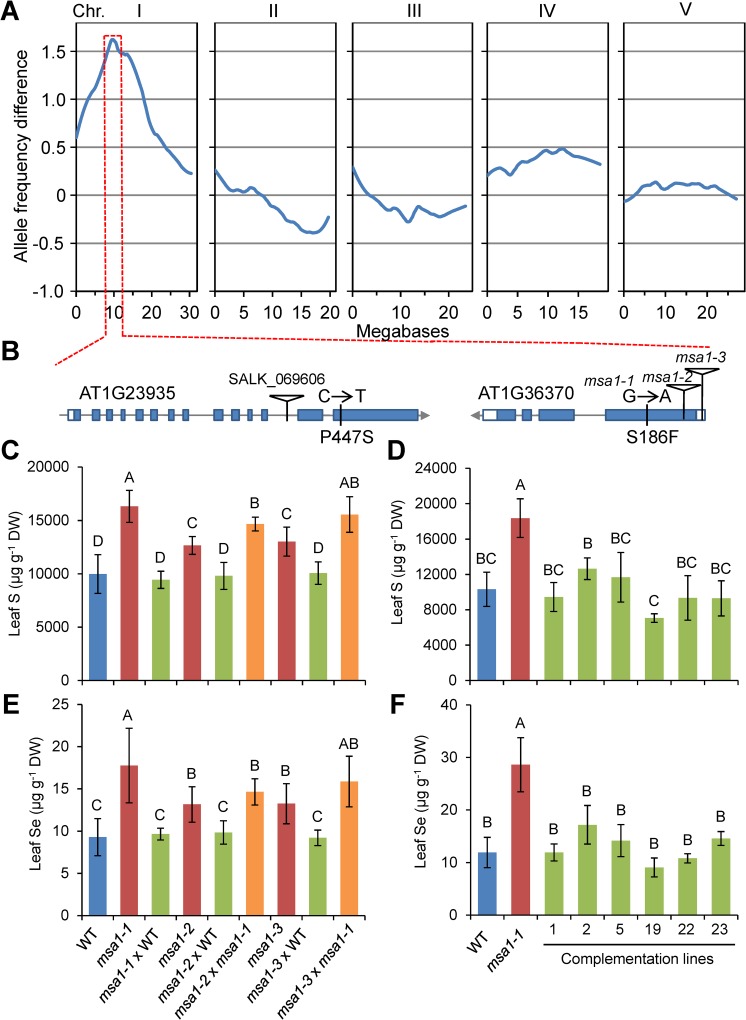
Fig 2. Identification the causal gene for msa1-1.
(A) Bulk segregant analysis (BSA) of the high leaf S phenotype in an msa1-1 × Ler-0 F2 population. Blue lines represent allele frequency differences between the pools of F2 plants with high and low leaf S (n = 40) at the polymorphic SNPs between Col-0 and Ler-0. (B) Identification of genes with mutations in the BSA confidence interval identified by SOLiD sequencing. Blue bars, grey lines and white bars represent exons, introns and untranslated region, respectively. (C, E) Genetic complementation of T-DNA insertion alleles by crossing with WT Col-0 or msa1-1. The S (C) and Se (E) content in leaves of F1 plants were determined. Data are presented as means ± SD (n = 6 to 12). (D, F) Transgenic complementation of the high S phenotype of msa1-1. The S (D) and Se (F) content in the leaves of six independent transgenic complementation lines were determined. Data are presented as means ± SD (n = 3 to 12). Columns with different letters indicate significant differences (P ≤ 0.01, least significant difference test). DW, dry weight. ICP-MS data is accessible using the digital object identifier (DOI) 10.4231/T95Q4T1C (see http://dx.doi.org/).

