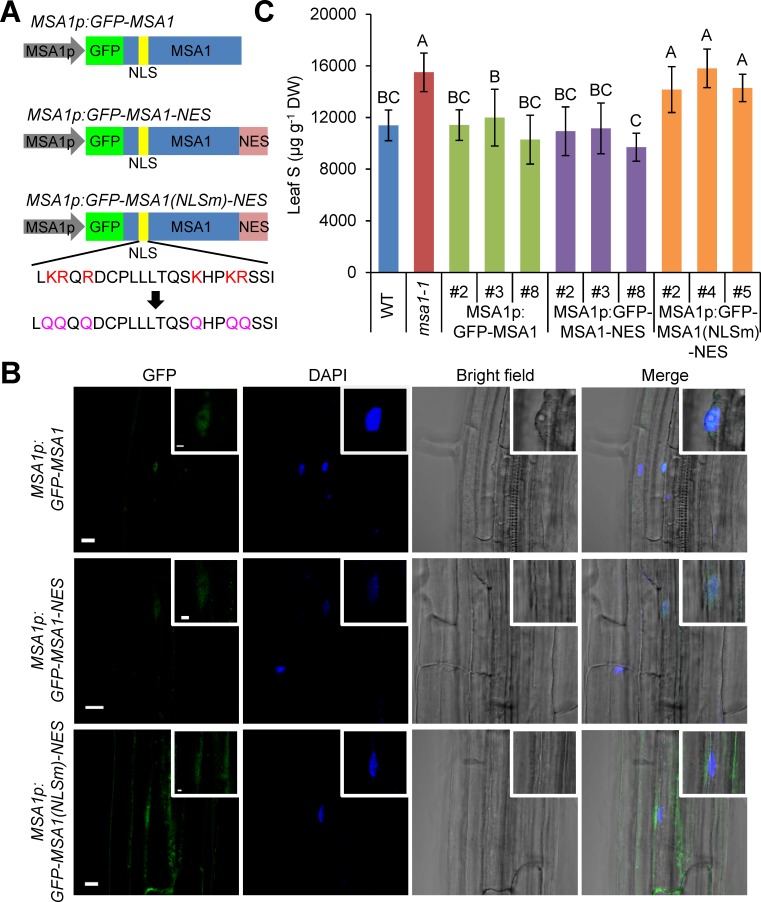
Fig 4. Localisation of MSA1 in cytosol could not suppress the high S phenotype of msa1-1.
(A) Schematic diagram of the constructs used for transformation of the msa1-1 mutant. MSA1p, MSA1 promoter; NLS, nuclear localization signal; NES, nuclear export signal. (B) Subcellular localization of GFP-MSA1 in transgenic lines in the msa1-1 mutant background transformed with the various constructs shown in (A). Insets show increased magnification of images showing the nucleus. Scale bar, 10μm and 2μm in the insets. (C) Total S in the leaves of five-week-old transgenic plants grown in soil. Three independent T2 lines are shown. Data presented as means ± SD (n = 9 to 12). Bars with different letters indicate significant differences (P ≤ 0.01, least significant difference test). DW, dry weight. ICP-MS data is accessible using the digital object identifier (DOI) 10.4231/T9PN93HT (see http://dx.doi.org/).

