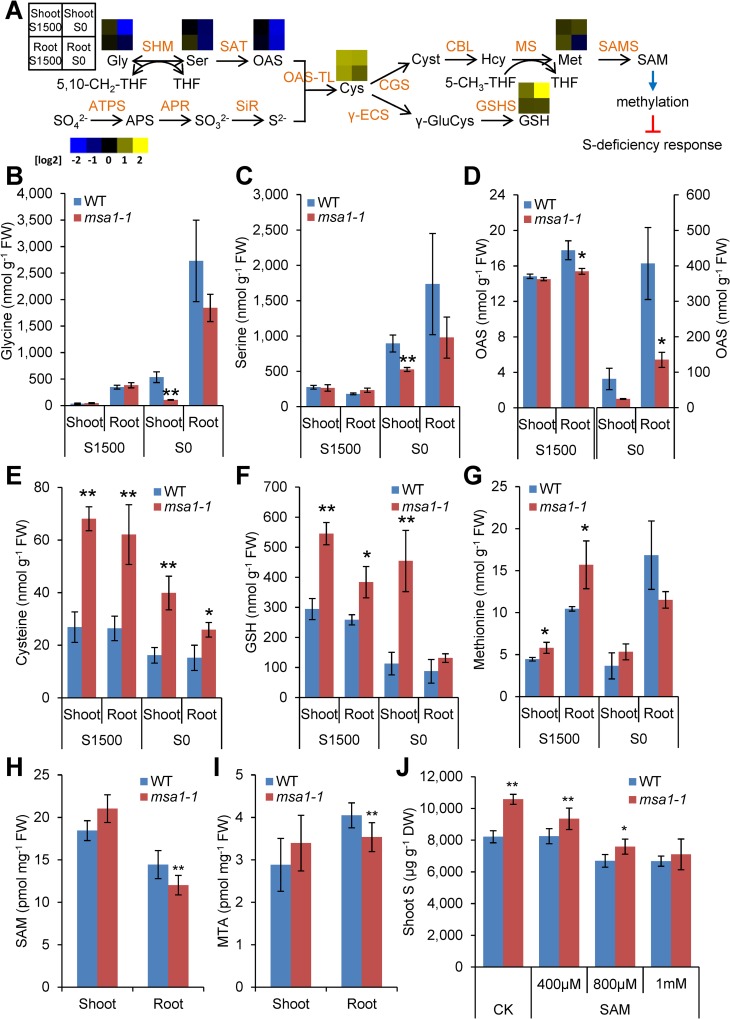
Fig 5. Metabolites quantification and supplementation.
(A) Schematic representation of sulphur assimilation in A. thaliana. Colour squares above the metabolites represent the log2 value of the msa1-1/WT Col-0 ratio of the concentration of each metabolite. APR: APS reductase; APS: adenosine 5’-phosphosulfate; ATPS: ATP sulfurylase; CBL: cystathionine β-lyase; CGS: cystathionine γ-synthase; Cyst: cystathionine; γ-ECS: γ-glutamylcysteine synthetase; γ-GluCys: γ-glutamylcysteine; GSHS: glutathione synthetase; Hcy: homocysteine; MS: methionine synthase; OAS: O-acetylserine; OAS-TL: OAS(thiol)lyase; SAT: serine acetyltransferase; SAMS, S-adenosylmethionine synthetase; SiR: sulphite reductase; SHM: serine hydroxymethyltransferase. (B-G) Measurement of sulphur-related metabolites. Plants were grown on agar solidified MGRL media under S sufficient (S1500) or S deficient (S0) conditions. Metabolites were extracted from shoots and roots and quantified by HPLC. Data are presented as means ± SD (n = 3). *, P ≤ 0.05; **, P ≤ 0.01, Student’s t test. (H-I) The concentrations of SAM and MTA in the shoots and roots of WT Col-0 and msa1-1 grown under S sufficient condition. (J) Total S in the shoots of WT Col-0 and msa1-1 grown under S sufficient condition without (CK) or with SAM added to the growth medium. Data in (B-J) are presented as means ± SD (n = 3 in (B-G), n = 5 in (H-I), and n = 6 in (J)). * and ** in (B-J) indicate values significantly different between WT Col-0 and msa1-1 mutant at P ≤ 0.05 and P ≤ 0.01, respectively (Student’s t test). DW, dry weight. CK, control.

