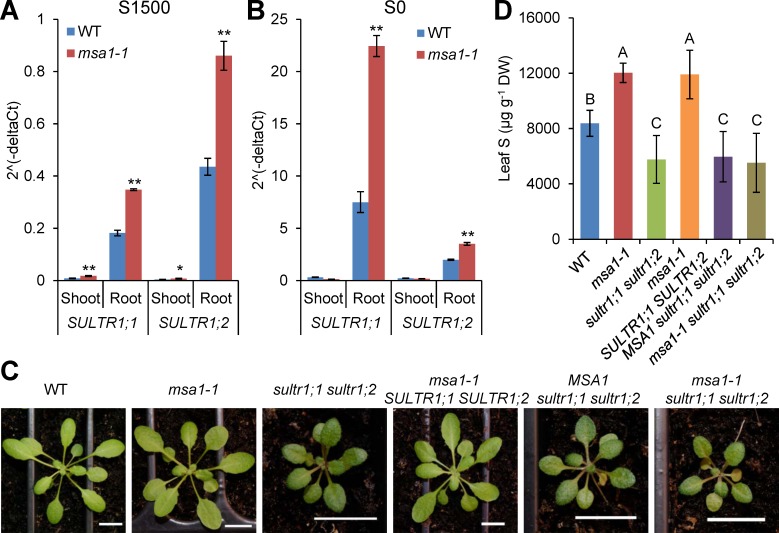
Fig 7. High leaf S phenotype of msa1-1 is dependent on two high-affinity sulphate transporters SULTR1;1 and SULTR1;2.
(A, B) Expression of SULTR1;1 and SULTR1;2 in the msa1-1 mutant. Quantitative RT-PCR analysis of SULTR1;1 and SULTR1;2 in the shoot and root of WT Col-0 and msa1-1. Plants were grown on agar solidified MGRL media for two weeks with sufficient sulphate (1500 μM; S1500) (A) or without added sulphate (S0) (B). Expression level was normalized to the internal control gene UBQ10, and presented as 2^(-deltaCt) with means ± SD (n = 3). * and ** represent significant differences between the WT and mutant at P ≤ 0.05 and P ≤ 0.01, respectively (Student’s t test). (C) Phenotype of five-week-old msa1-1 sultr1;1 sultr1;2 triple mutant and control lines. Pictures were taken before harvesting for ICP-MS analysis. Scale bars in all images represent 1 cm. (D) Total S in the leaves of five-week-old msa1-1 sultr1;1 sultr1;2 triple mutant and control lines. Data are presented as means ± SD (n = 11 or 12). Bars with different letters indicate significant differences (P ≤ 0.01, least significant difference test). DW, dry weight.

