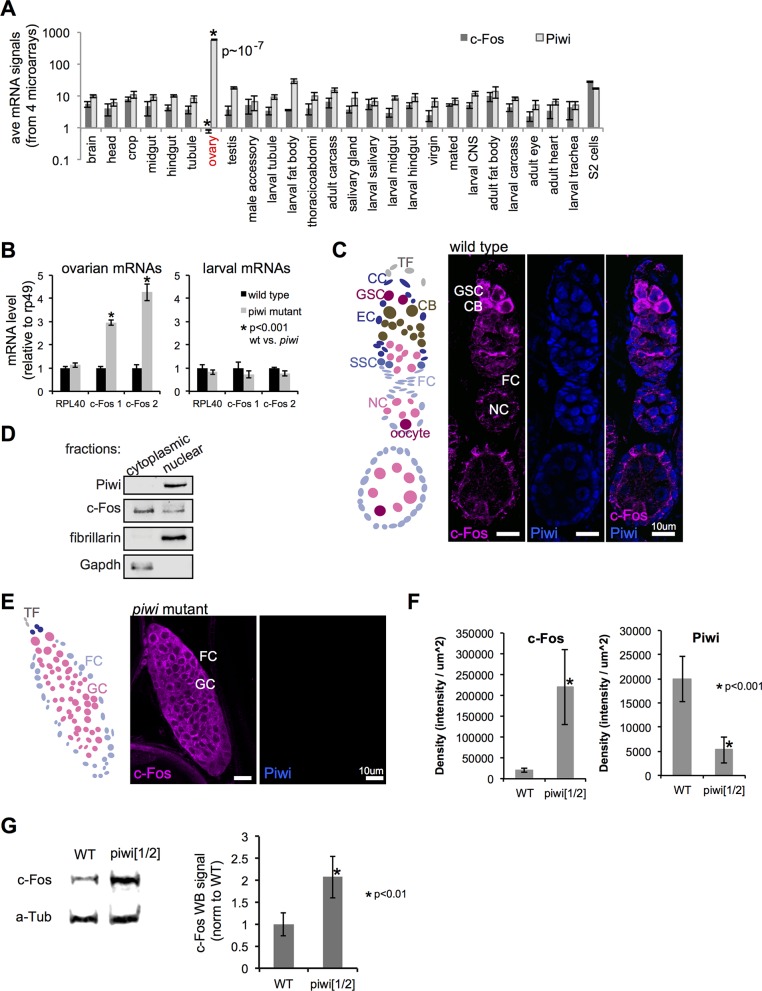
Fig 2. Piwi represses c-Fos in ovarian somatic and germ cells.
(A) Average mRNA levels of c-Fos and Piwi across 26 distinct adult and larval tissue types, from 4 replicate data with Affymetrix Dros Genome 2 chips [34]. The Grubb’s test shows that in the ovary c-Fos and Piwi are strongly negatively correlated in the ovary (P < 10−7). (B) RT-qPCR quantitation of RPL40 and c-Fos (standardized by rp49) mRNAs in ovarian cells or larval cells from the wild-type and piwi[1/2] mutant. c-Fos 1 and c-Fos 2 are 2 different sets of RT-qPCR primers used to quantitate the c-Fos cDNA. c-Fos (magenta) and Piwi (blue) IF of (C) a wild-type or (E) piwi[1/2] ovariole. Labeled cell types are, respectively, TF, terminal filament; CC, cap cell; GSC, germline stem cell; CB, cystoblast; EC, escort cell; SSC, somatic stem cell; FC, follicle cell; NC, nurse cell; oocyte. (D) Piwi, c-Fos, fibrillarin, and Gapdh WB analysis of cytoplasmic and nuclear fractionation of wild-type ovarian cells. (F) Quantitation of c-Fos and Piwi IF signals (intensity/μm2) in wild-type and piwi[1/2] mutant ovarian cells. (G) Left: representative c-Fos and α-tubulin WB of wild-type and piwi ovarian extract. Right: quantitation of data from triplicate c-Fos WB using α-tubulin for normalization. Error bars represent standard deviation, and the Student’s t test was used for statistical comparison.

