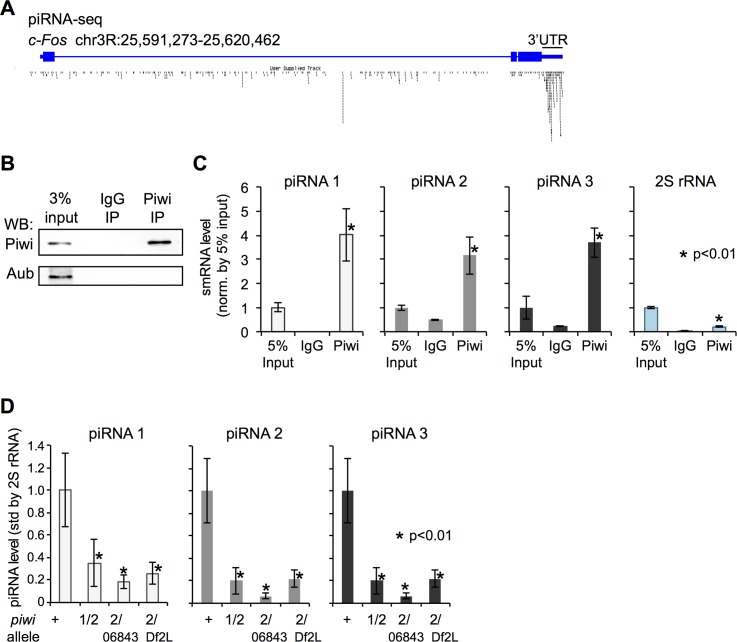
Fig 3. The 3′ UTR from the c-Fos mRNA is a primary piRNA precursor.
(A) Diagram of the c-Fos locus. Published piRNA sequences are represented by black dashes. (B) Piwi and Aub WB of Piwi and IgG IP from wild-type ovarian cells. (C) TaqMan RT-qPCR quantitation of putative piRNAs 1–3 (unique to the c-Fos 3′ UTR) and 2S rRNA. The 5% input serves as normalization. (D) TaqMan RT-qPCR analysis of putative piRNAs 1–3 in ovarian cells from wild-type and 3 piwi mutant allele combinations. 2S rRNA served as normalization. Values represent means of 3 RT reactions, with error bars representing standard deviation and the Student’s t test used for statistical comparison.

