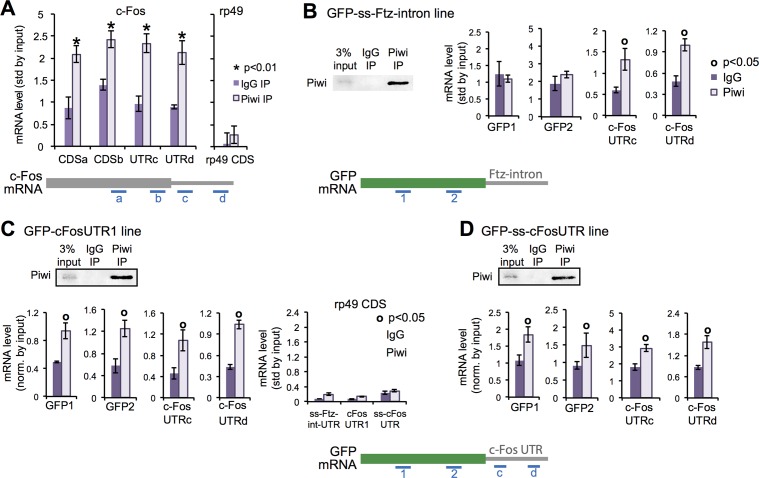
Fig 5. The 3′ UTR of c-Fos recruits Piwi.
(A) RT-qPCR analysis of Piwi and IgG IP’d mRNAs. Diagram of the c-Fos mRNA indicates the regions amplified by primer sets a-d. (B) Western blot of Piwi and IgG IP from ovarian extract of Tj:GFP-ssFtz-UTR and RT-qPCR analysis of Piwi and IgG IP’d mRNAs. Diagram of the GFP mRNA indicates the regions amplified by primer sets 1 and 2. The 5% input served as normalization. (C) As in (B), using ovarian extract from Tj:GFP-c-Fos-UTR1 (generated by random integration). (D) as in (B), using Tj:GFP-ss-c-FosUTR (generated by site-specific integration). Error bars represent standard deviation, and the Student’s t test was used for statistical comparison.

