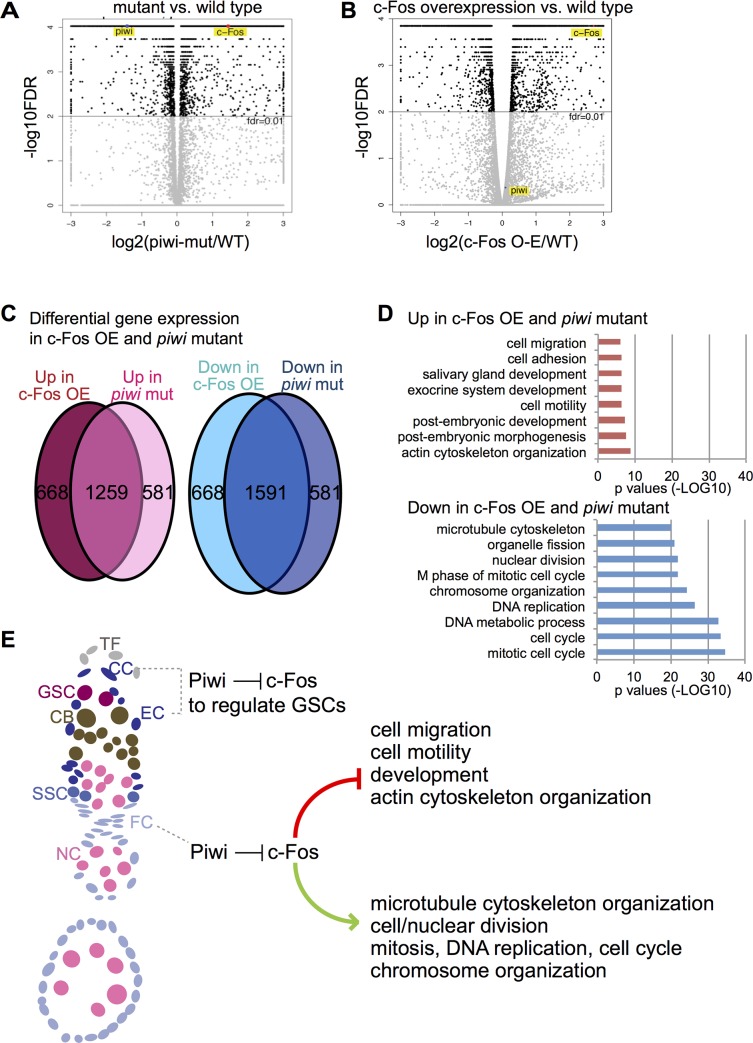
Fig 8. The transcriptomes are similar between the piwi mutant and somatic c-Fos overexpressing ovarian cells.
Comparison of Gene expression profiles between (A) piwi mutant and wild type or (B) c-Fos overexpression and wild type by RNA-seq. c-Fos and Piwi are indicated in the comparative graphs. Upregulation and downregulation were determined by using a false discovery rate <0.01 and > 1.5-fold. Note that c-Fos is upregulated in both (A) and (B). (C) Venn diagrams indicate the overlap of upregulated and downregulated genes (compared to wild type) in c-Fos overexpression and piwi mutant ovarian cells. (D) Graphs indicate gene ontology categories and p-values of upregulated and downregulated genes in both c-Fos overexpression and piwi mutant. (E) Proposed model of c-Fos repression by Piwi in the somatic niche (cap cells and escort cells) to influence GSCs and in the somatic/follicle cells to regulate defined cellular processes. Labeled cell types are, respectively, TF, terminal filament; CC, cap cell; GSC, germline stem cell; CB, cystoblast; EC, escort cell; SSC, somatic stem cell; FC, follicle cell; NC, nurse cell; oocyte.

